

150
3 – Transport in ionic solids
ORJ>L@>LLQFP
<
@
ORJ3 %U >3 %U LQEDU@
<
<
<
<
<
<
9ƍ .
>9ƍ . @>9
%U @
>9ƍ . @>K
@
9
%U
9
#
%U
9
#
.
>9
%U @>Hƍ@
K
Hƍ
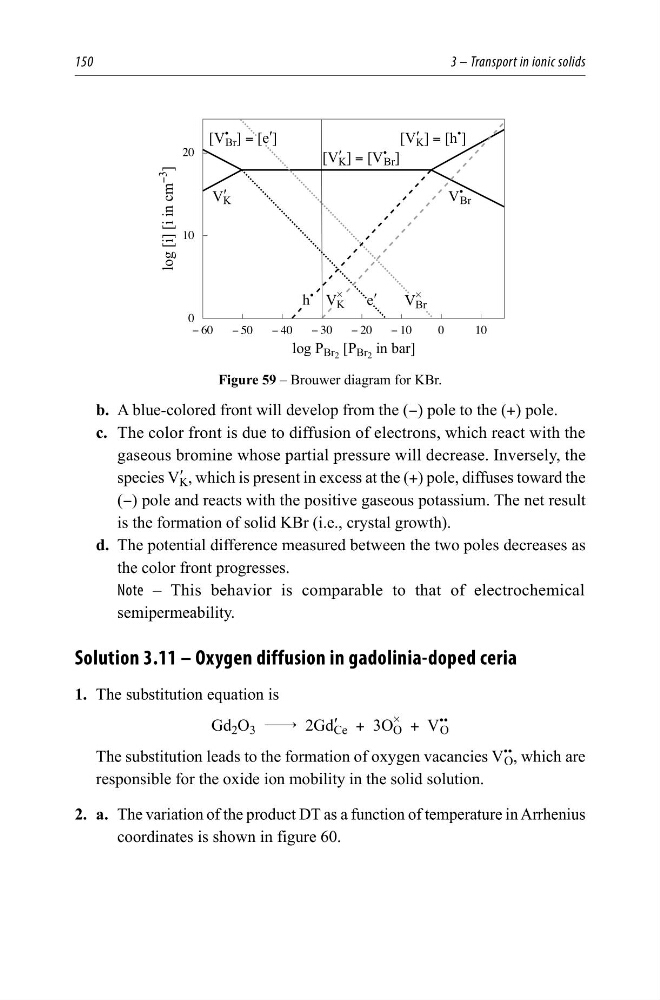
Figure 59 – Brouwer diagram for KBr.
b. A blue-colored front will develop from the (−) pole to the (+) pole.
c. The color front is due to diffusion of electrons, which react with the
gaseous bromine whose partial pressure will decrease. Inversely, the
species V ′
K , which is present in excess at the (+) pole, diffuses toward the
(−) pole and reacts with the positive gaseous potassium. The net result
is the formation of solid KBr (i.e., crystal growth).
d. The potential difference measured between the two poles decreases as
the color front progresses.
Note – This behavior is comparable to that of electrochemical
semipermeability.
Solution 3.11 – Oxygen diffusion in gadolinia-doped ceria
1. The substitution equation is
Gd 2 O 3 $ 2Gd ′
Ce + 3O
#
O + V
••
O
The substitution leads to the formation of oxygen vacancies V
••
O , which are
responsible for the oxide ion mobility in the solid solution.
2. a. The variation of the product DT as a function of temperature in Arrhenius
coordinates is shown in figure 60.
3 – Transport in ionic solids
ORJ>L@>LLQFP
<
@
ORJ3 %U >3 %U LQEDU@
<
<
<
<
<
<
9ƍ .
>9ƍ . @>9
%U @
>9ƍ . @>K
@
9
%U
9
#
%U
9
#
.
>9
%U @>Hƍ@
K
Hƍ
Figure 59 – Brouwer diagram for KBr.
b. A blue-colored front will develop from the (−) pole to the (+) pole.
c. The color front is due to diffusion of electrons, which react with the
gaseous bromine whose partial pressure will decrease. Inversely, the
species V ′
K , which is present in excess at the (+) pole, diffuses toward the
(−) pole and reacts with the positive gaseous potassium. The net result
is the formation of solid KBr (i.e., crystal growth).
d. The potential difference measured between the two poles decreases as
the color front progresses.
Note – This behavior is comparable to that of electrochemical
semipermeability.
Solution 3.11 – Oxygen diffusion in gadolinia-doped ceria
1. The substitution equation is
Gd 2 O 3 $ 2Gd ′
Ce + 3O
#
O + V
••
O
The substitution leads to the formation of oxygen vacancies V
••
O , which are
responsible for the oxide ion mobility in the solid solution.
2. a. The variation of the product DT as a function of temperature in Arrhenius
coordinates is shown in figure 60.