

110
3 – Transport in ionic solids
Table 28 – Conductivity of NiO as a function of oxygen
partial pressure at 1 000 °C (from Pope & Birks, 1977).
P O 2
[bar]
10
2
σ
[S cm
−1
]
P O 2
[bar]
10
2
σ
[S cm
−1
]
P O 2
[bar]
10
2
σ
[S cm
−1
]
1
16.7
4.79 # 10
−4
2.66
4.79 # 10
−9
0.266
0.21
10.0
1.58 # 10
−4
1.87
4 # 10
−9
0.251
1 # 10
−2
5.55
1.32 # 10
−4
1.80
1.91 # 10
−9
0.213
1.92 # 10
−2
5.95
1.23 # 10
−4
2.41
1.59 # 10
−9
0.227
1.33 # 10
−2
5.41
1.10 # 10
−7
0.593
1.14 # 10
−9
0.208
2.52 # 10
−2
3.77
3.30 # 10
−7
0.427
1.1 # 10
−9
0.200
1.20 # 10
−3
3.39
1.00 # 10
−8
0.300
4.49 # 10
−10
0.192
6.93 # 10
−4
2.22
5.17 # 10
−9
0.282
2.47 # 10
−10
0.175
1. In logarithmic coordinates, graph the total electrical conductivity of NiO
as a function of oxygen partial pressure at 1 000 °C. Determine the slopes
of the lines at low (P O 2
< 10
−6 bar
) and high (P O 2
>10
−4 bar
) pressure.
2. Describe the theoretical models for defects that explain the slopes observed.
3. Explain the different behavior as a function of oxygen partial pressure. What
are the dominant atomic defects at the highest P O 2 ?
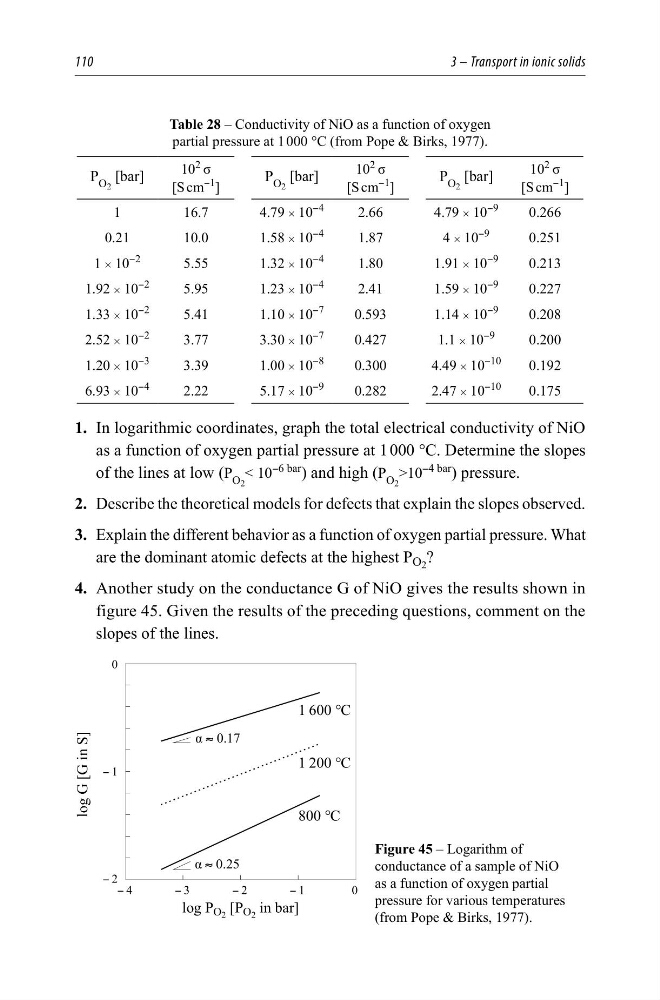
4. Another study on the conductance G of NiO gives the results shown in
figure 45. Given the results of the preceding questions, comment on the
slopes of the lines.
<
<
<
<
<
<
ORJ3 2 >3 2 LQEDU@
ORJ*>*LQ6@
&
&
&
Į5
Į5
Figure 45 – Logarithm of
conductance of a sample of NiO
as a function of oxygen partial
pressure for various temperatures
(from Pope & Birks, 1977).
3 – Transport in ionic solids
Table 28 – Conductivity of NiO as a function of oxygen
partial pressure at 1 000 °C (from Pope & Birks, 1977).
P O 2
[bar]
10
2
σ
[S cm
−1
]
P O 2
[bar]
10
2
σ
[S cm
−1
]
P O 2
[bar]
10
2
σ
[S cm
−1
]
1
16.7
4.79 # 10
−4
2.66
4.79 # 10
−9
0.266
0.21
10.0
1.58 # 10
−4
1.87
4 # 10
−9
0.251
1 # 10
−2
5.55
1.32 # 10
−4
1.80
1.91 # 10
−9
0.213
1.92 # 10
−2
5.95
1.23 # 10
−4
2.41
1.59 # 10
−9
0.227
1.33 # 10
−2
5.41
1.10 # 10
−7
0.593
1.14 # 10
−9
0.208
2.52 # 10
−2
3.77
3.30 # 10
−7
0.427
1.1 # 10
−9
0.200
1.20 # 10
−3
3.39
1.00 # 10
−8
0.300
4.49 # 10
−10
0.192
6.93 # 10
−4
2.22
5.17 # 10
−9
0.282
2.47 # 10
−10
0.175
1. In logarithmic coordinates, graph the total electrical conductivity of NiO
as a function of oxygen partial pressure at 1 000 °C. Determine the slopes
of the lines at low (P O 2
< 10
−6 bar
) and high (P O 2
>10
−4 bar
) pressure.
2. Describe the theoretical models for defects that explain the slopes observed.
3. Explain the different behavior as a function of oxygen partial pressure. What
are the dominant atomic defects at the highest P O 2 ?
4. Another study on the conductance G of NiO gives the results shown in
figure 45. Given the results of the preceding questions, comment on the
slopes of the lines.
<
<
<
<
<
<
ORJ3 2 >3 2 LQEDU@
ORJ*>*LQ6@
&
&
&
Į5
Į5
Figure 45 – Logarithm of
conductance of a sample of NiO
as a function of oxygen partial
pressure for various temperatures
(from Pope & Birks, 1977).