

3.6 Responsibility and Potential to Act
According to the aspiration of the Convention on Biological Diversity (CBD) almost
all countries in the world follow the goal to protect species from extinction. We used
the economic power in combination with the pressure on biodiversity as indicator for
both national responsibility and potential to develop nature conservation
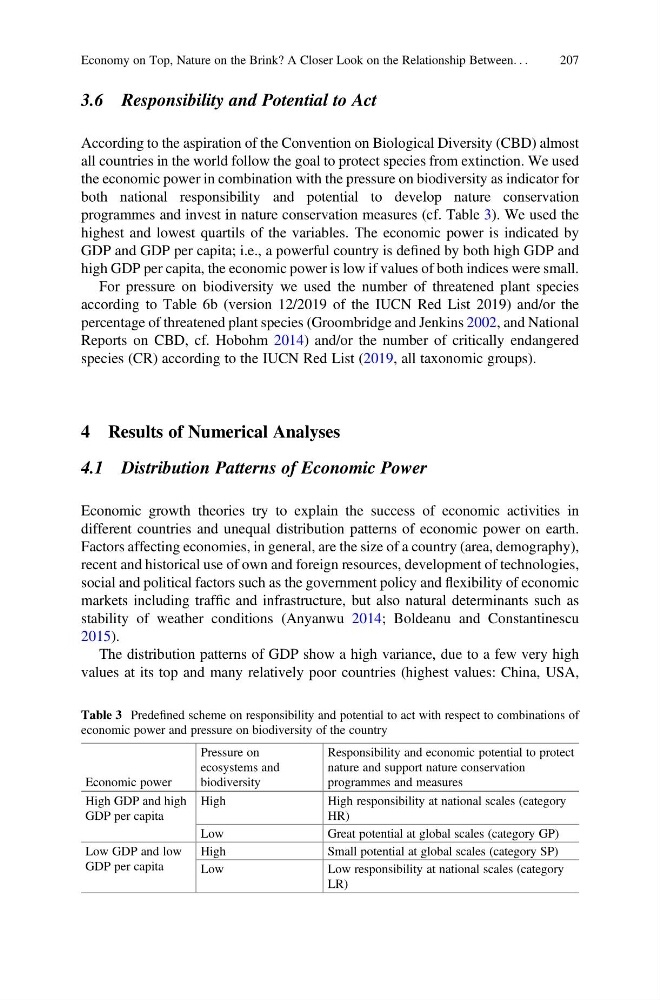
programmes and invest in nature conservation measures (cf. Table 3). We used the
highest and lowest quartils of the variables. The economic power is indicated by
GDP and GDP per capita; i.e., a powerful country is defined by both high GDP and
high GDP per capita, the economic power is low if values of both indices were small.
For pressure on biodiversity we used the number of threatened plant species
according to Table 6b (version 12/2019 of the IUCN Red List 2019) and/or the
percentage of threatened plant species (Groombridge and Jenkins 2002, and National
Reports on CBD, cf. Hobohm 2014) and/or the number of critically endangered
species (CR) according to the IUCN Red List (2019, all taxonomic groups).
4 Results of Numerical Analyses
4.1 Distribution Patterns of Economic Power
Economic growth theories try to explain the success of economic activities in
different countries and unequal distribution patterns of economic power on earth.
Factors affecting economies, in general, are the size of a country (area, demography),
recent and historical use of own and foreign resources, development of technologies,
social and political factors such as the government policy and flexibility of economic
markets including traffic and infrastructure, but also natural determinants such as
stability of weather conditions (Anyanwu 2014; Boldeanu and Constantinescu
2015).
The distribution patterns of GDP show a high variance, due to a few very high
values at its top and many relatively poor countries (highest values: China, USA,
Table 3 Predefined scheme on responsibility and potential to act with respect to combinations of
economic power and pressure on biodiversity of the country
Economic power
Pressure on
ecosystems and
biodiversity
Responsibility and economic potential to protect
nature and support nature conservation
programmes and measures
High GDP and high
GDP per capita
High
High responsibility at national scales (category
HR)
Low
Great potential at global scales (category GP)
Low GDP and low
GDP per capita
High
Small potential at global scales (category SP)
Low
Low responsibility at national scales (category
LR)
Economy on Top, Nature on the Brink? A Closer Look on the Relationship Between. . .
207
According to the aspiration of the Convention on Biological Diversity (CBD) almost
all countries in the world follow the goal to protect species from extinction. We used
the economic power in combination with the pressure on biodiversity as indicator for
both national responsibility and potential to develop nature conservation
programmes and invest in nature conservation measures (cf. Table 3). We used the
highest and lowest quartils of the variables. The economic power is indicated by
GDP and GDP per capita; i.e., a powerful country is defined by both high GDP and
high GDP per capita, the economic power is low if values of both indices were small.
For pressure on biodiversity we used the number of threatened plant species
according to Table 6b (version 12/2019 of the IUCN Red List 2019) and/or the
percentage of threatened plant species (Groombridge and Jenkins 2002, and National
Reports on CBD, cf. Hobohm 2014) and/or the number of critically endangered
species (CR) according to the IUCN Red List (2019, all taxonomic groups).
4 Results of Numerical Analyses
4.1 Distribution Patterns of Economic Power
Economic growth theories try to explain the success of economic activities in
different countries and unequal distribution patterns of economic power on earth.
Factors affecting economies, in general, are the size of a country (area, demography),
recent and historical use of own and foreign resources, development of technologies,
social and political factors such as the government policy and flexibility of economic
markets including traffic and infrastructure, but also natural determinants such as
stability of weather conditions (Anyanwu 2014; Boldeanu and Constantinescu
2015).
The distribution patterns of GDP show a high variance, due to a few very high
values at its top and many relatively poor countries (highest values: China, USA,
Table 3 Predefined scheme on responsibility and potential to act with respect to combinations of
economic power and pressure on biodiversity of the country
Economic power
Pressure on
ecosystems and
biodiversity
Responsibility and economic potential to protect
nature and support nature conservation
programmes and measures
High GDP and high
GDP per capita
High
High responsibility at national scales (category
HR)
Low
Great potential at global scales (category GP)
Low GDP and low
GDP per capita
High
Small potential at global scales (category SP)
Low
Low responsibility at national scales (category
LR)
Economy on Top, Nature on the Brink? A Closer Look on the Relationship Between. . .
207