

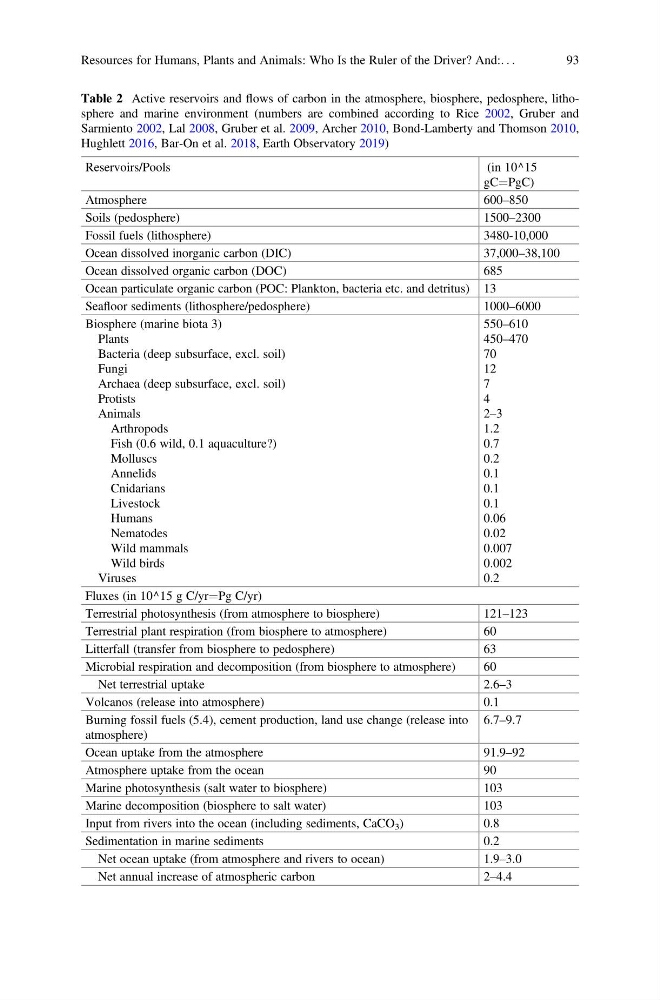
Table 2 Active reservoirs and flows of carbon in the atmosphere, biosphere, pedosphere, lithosphere and marine environment (numbers are combined according to Rice 2002, Gruber and
Sarmiento 2002, Lal 2008, Gruber et al. 2009, Archer 2010, Bond-Lamberty and Thomson 2010,
Hughlett 2016, Bar-On et al. 2018, Earth Observatory 2019)
Reservoirs/Pools
(in 10^15
gC¼PgC)
Atmosphere
600–850
Soils (pedosphere)
1500–2300
Fossil fuels (lithosphere)
3480-10,000
Ocean dissolved inorganic carbon (DIC)
37,000–38,100
Ocean dissolved organic carbon (DOC)
685
Ocean particulate organic carbon (POC: Plankton, bacteria etc. and detritus) 13
Seafloor sediments (lithosphere/pedosphere)
1000–6000
Biosphere (marine biota 3)
Plants
Bacteria (deep subsurface, excl. soil)
Fungi
Archaea (deep subsurface, excl. soil)
Protists
Animals
Arthropods
Fish (0.6 wild, 0.1 aquaculture?)
Molluscs
Annelids
Cnidarians
Livestock
Humans
Nematodes
Wild mammals
Wild birds
Viruses
550–610
450–470
70
12
7
4
2–3
1.2
0.7
0.2
0.1
0.1
0.1
0.06
0.02
0.007
0.002
0.2
Fluxes (in 10^15 g C/yr¼Pg C/yr)
Terrestrial photosynthesis (from atmosphere to biosphere)
121–123
Terrestrial plant respiration (from biosphere to atmosphere)
60
Litterfall (transfer from biosphere to pedosphere)
63
Microbial respiration and decomposition (from biosphere to atmosphere)
60
Net terrestrial uptake
2.6–3
Volcanos (release into atmosphere)
0.1
Burning fossil fuels (5.4), cement production, land use change (release into
atmosphere)
6.7–9.7
Ocean uptake from the atmosphere
91.9–92
Atmosphere uptake from the ocean
90
Marine photosynthesis (salt water to biosphere)
103
Marine decomposition (biosphere to salt water)
103
Input from rivers into the ocean (including sediments, CaCO 3 )
0.8
Sedimentation in marine sediments
0.2
Net ocean uptake (from atmosphere and rivers to ocean)
1.9–3.0
Net annual increase of atmospheric carbon
2–4.4
Resources for Humans, Plants and Animals: Who Is the Ruler of the Driver? And:. . .
93
Sarmiento 2002, Lal 2008, Gruber et al. 2009, Archer 2010, Bond-Lamberty and Thomson 2010,
Hughlett 2016, Bar-On et al. 2018, Earth Observatory 2019)
Reservoirs/Pools
(in 10^15
gC¼PgC)
Atmosphere
600–850
Soils (pedosphere)
1500–2300
Fossil fuels (lithosphere)
3480-10,000
Ocean dissolved inorganic carbon (DIC)
37,000–38,100
Ocean dissolved organic carbon (DOC)
685
Ocean particulate organic carbon (POC: Plankton, bacteria etc. and detritus) 13
Seafloor sediments (lithosphere/pedosphere)
1000–6000
Biosphere (marine biota 3)
Plants
Bacteria (deep subsurface, excl. soil)
Fungi
Archaea (deep subsurface, excl. soil)
Protists
Animals
Arthropods
Fish (0.6 wild, 0.1 aquaculture?)
Molluscs
Annelids
Cnidarians
Livestock
Humans
Nematodes
Wild mammals
Wild birds
Viruses
550–610
450–470
70
12
7
4
2–3
1.2
0.7
0.2
0.1
0.1
0.1
0.06
0.02
0.007
0.002
0.2
Fluxes (in 10^15 g C/yr¼Pg C/yr)
Terrestrial photosynthesis (from atmosphere to biosphere)
121–123
Terrestrial plant respiration (from biosphere to atmosphere)
60
Litterfall (transfer from biosphere to pedosphere)
63
Microbial respiration and decomposition (from biosphere to atmosphere)
60
Net terrestrial uptake
2.6–3
Volcanos (release into atmosphere)
0.1
Burning fossil fuels (5.4), cement production, land use change (release into
atmosphere)
6.7–9.7
Ocean uptake from the atmosphere
91.9–92
Atmosphere uptake from the ocean
90
Marine photosynthesis (salt water to biosphere)
103
Marine decomposition (biosphere to salt water)
103
Input from rivers into the ocean (including sediments, CaCO 3 )
0.8
Sedimentation in marine sediments
0.2
Net ocean uptake (from atmosphere and rivers to ocean)
1.9–3.0
Net annual increase of atmospheric carbon
2–4.4
Resources for Humans, Plants and Animals: Who Is the Ruler of the Driver? And:. . .
93