

32 Fabrication of Charge-Transfer Complex Nanocrystals …
553
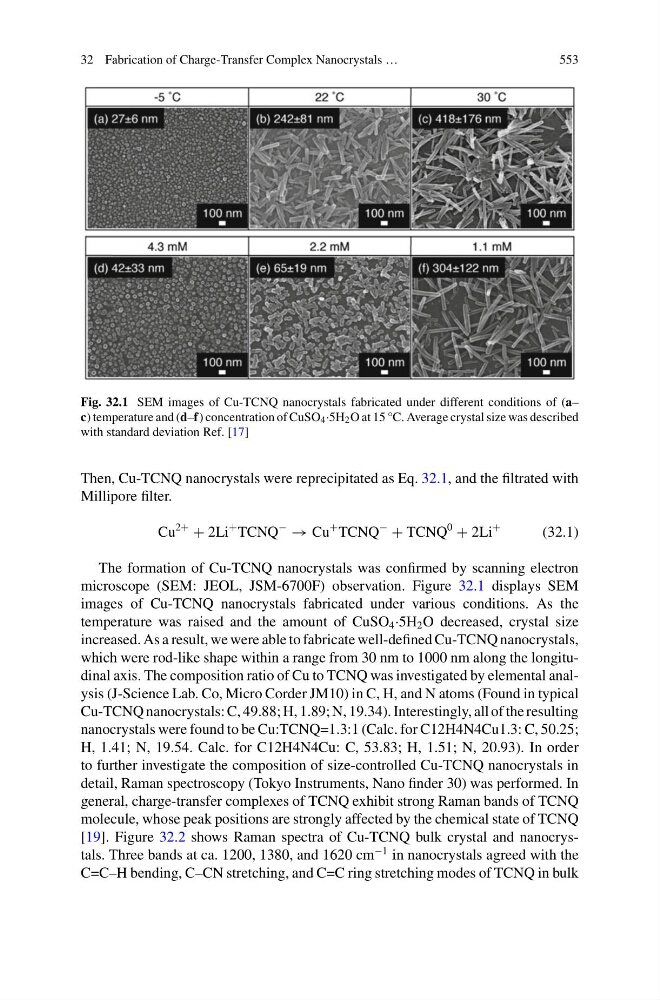
Fig. 32.1 SEM images of Cu-TCNQ nanocrystals fabricated under different conditions of (a–
c) temperature and (d–f) concentration of CuSO 4 ·5H 2 O at 15 °C. Average crystal size was described
with standard deviation Ref. [17]
Then, Cu-TCNQ nanocrystals were reprecipitated as Eq. 32.1, and the filtrated with
Millipore filter.
Cu
2+
+ 2Li
+ TCNQ
−
→ Cu
+ TCNQ
−
+ TCNQ
0
+ 2Li
+
(32.1)
The formation of Cu-TCNQ nanocrystals was confirmed by scanning electron
microscope (SEM: JEOL, JSM-6700F) observation. Figure 32.1 displays SEM
images of Cu-TCNQ nanocrystals fabricated under various conditions. As the
temperature was raised and the amount of CuSO 4 ·5H 2 O decreased, crystal size
increased. As a result, we were able to fabricate well-defined Cu-TCNQ nanocrystals,
which were rod-like shape within a range from 30 nm to 1000 nm along the longitudinal axis. The composition ratio of Cu to TCNQ was investigated by elemental analysis (J-Science Lab. Co, Micro Corder JM10) in C, H, and N atoms (Found in typical
Cu-TCNQ nanocrystals: C, 49.88; H, 1.89; N, 19.34). Interestingly, all of the resulting
nanocrystals were found to be Cu:TCNQ=1.3:1 (Calc. for C12H4N4Cu1.3: C, 50.25;
H, 1.41; N, 19.54. Calc. for C12H4N4Cu: C, 53.83; H, 1.51; N, 20.93). In order
to further investigate the composition of size-controlled Cu-TCNQ nanocrystals in
detail, Raman spectroscopy (Tokyo Instruments, Nano finder 30) was performed. In
general, charge-transfer complexes of TCNQ exhibit strong Raman bands of TCNQ
molecule, whose peak positions are strongly affected by the chemical state of TCNQ
[19]. Figure 32.2 shows Raman spectra of Cu-TCNQ bulk crystal and nanocrystals. Three bands at ca. 1200, 1380, and 1620 cm
−1 in nanocrystals agreed with the
C=C–H bending, C–CN stretching, and C=C ring stretching modes of TCNQ in bulk
553
Fig. 32.1 SEM images of Cu-TCNQ nanocrystals fabricated under different conditions of (a–
c) temperature and (d–f) concentration of CuSO 4 ·5H 2 O at 15 °C. Average crystal size was described
with standard deviation Ref. [17]
Then, Cu-TCNQ nanocrystals were reprecipitated as Eq. 32.1, and the filtrated with
Millipore filter.
Cu
2+
+ 2Li
+ TCNQ
−
→ Cu
+ TCNQ
−
+ TCNQ
0
+ 2Li
+
(32.1)
The formation of Cu-TCNQ nanocrystals was confirmed by scanning electron
microscope (SEM: JEOL, JSM-6700F) observation. Figure 32.1 displays SEM
images of Cu-TCNQ nanocrystals fabricated under various conditions. As the
temperature was raised and the amount of CuSO 4 ·5H 2 O decreased, crystal size
increased. As a result, we were able to fabricate well-defined Cu-TCNQ nanocrystals,
which were rod-like shape within a range from 30 nm to 1000 nm along the longitudinal axis. The composition ratio of Cu to TCNQ was investigated by elemental analysis (J-Science Lab. Co, Micro Corder JM10) in C, H, and N atoms (Found in typical
Cu-TCNQ nanocrystals: C, 49.88; H, 1.89; N, 19.34). Interestingly, all of the resulting
nanocrystals were found to be Cu:TCNQ=1.3:1 (Calc. for C12H4N4Cu1.3: C, 50.25;
H, 1.41; N, 19.54. Calc. for C12H4N4Cu: C, 53.83; H, 1.51; N, 20.93). In order
to further investigate the composition of size-controlled Cu-TCNQ nanocrystals in
detail, Raman spectroscopy (Tokyo Instruments, Nano finder 30) was performed. In
general, charge-transfer complexes of TCNQ exhibit strong Raman bands of TCNQ
molecule, whose peak positions are strongly affected by the chemical state of TCNQ
[19]. Figure 32.2 shows Raman spectra of Cu-TCNQ bulk crystal and nanocrystals. Three bands at ca. 1200, 1380, and 1620 cm
−1 in nanocrystals agreed with the
C=C–H bending, C–CN stretching, and C=C ring stretching modes of TCNQ in bulk