

532
M. Vacha and S. Hirata
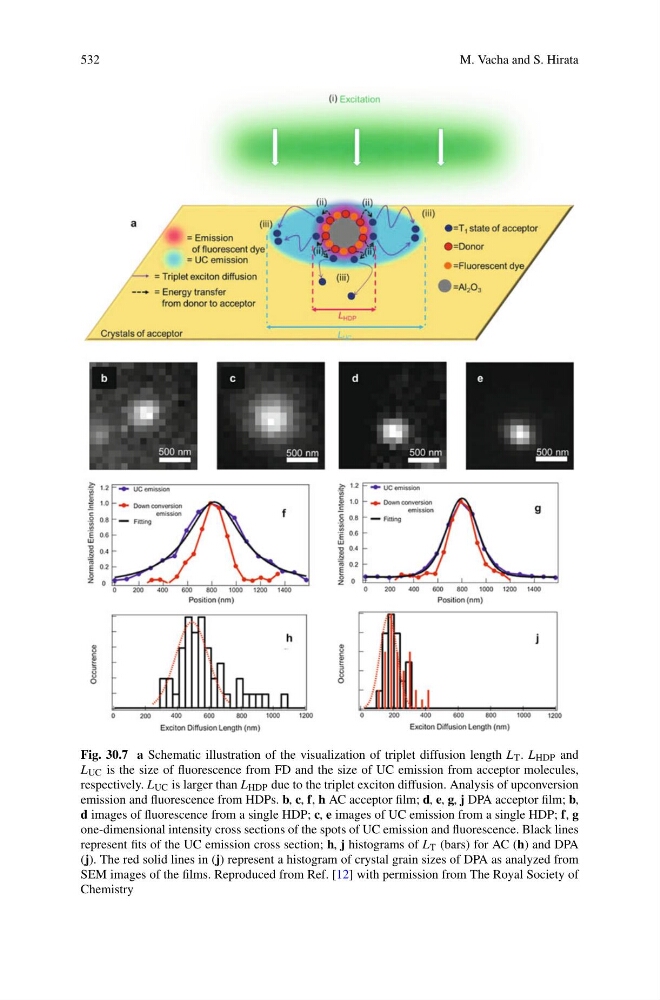
Fig. 30.7 a Schematic illustration of the visualization of triplet diffusion length L T . L HDP and
L UC is the size of fluorescence from FD and the size of UC emission from acceptor molecules,
respectively. L UC is larger than L HDP due to the triplet exciton diffusion. Analysis of upconversion
emission and fluorescence from HDPs. b, c, f, h AC acceptor film; d, e, g, j DPA acceptor film; b,
d images of fluorescence from a single HDP; c, e images of UC emission from a single HDP; f, g
one-dimensional intensity cross sections of the spots of UC emission and fluorescence. Black lines
represent fits of the UC emission cross section; h, j histograms of L T (bars) for AC (h) and DPA
(j). The red solid lines in (j) represent a histogram of crystal grain sizes of DPA as analyzed from
SEM images of the films. Reproduced from Ref. [12] with permission from The Royal Society of
Chemistry
M. Vacha and S. Hirata
Fig. 30.7 a Schematic illustration of the visualization of triplet diffusion length L T . L HDP and
L UC is the size of fluorescence from FD and the size of UC emission from acceptor molecules,
respectively. L UC is larger than L HDP due to the triplet exciton diffusion. Analysis of upconversion
emission and fluorescence from HDPs. b, c, f, h AC acceptor film; d, e, g, j DPA acceptor film; b,
d images of fluorescence from a single HDP; c, e images of UC emission from a single HDP; f, g
one-dimensional intensity cross sections of the spots of UC emission and fluorescence. Black lines
represent fits of the UC emission cross section; h, j histograms of L T (bars) for AC (h) and DPA
(j). The red solid lines in (j) represent a histogram of crystal grain sizes of DPA as analyzed from
SEM images of the films. Reproduced from Ref. [12] with permission from The Royal Society of
Chemistry