

30 Single-Molecule Level Study and Control …
529
DPA
PtOEP
Ag NW
400
500
600
700
Luminescence (a.u.)
Normalized extinction
Wavelength (nm)
c
b
e
d Phosphorescence
Upconversion
f
Upconversion
Phosphoresc.
1.0 1.5 2.0 2.5 3.0 3.5 4.0 4.5
Intensity (a.u.)
Distance (µm)
donor: PtOEP
acceptor: DPA
PMMA film
Ag NW
plasmonic hot spot
a
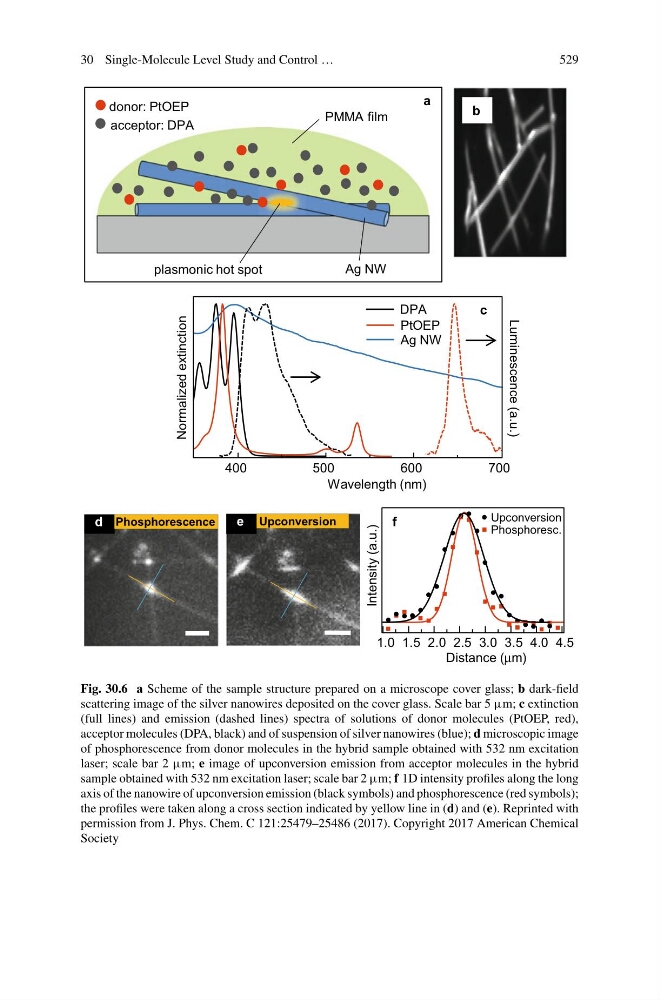
Fig. 30.6 a Scheme of the sample structure prepared on a microscope cover glass; b dark-field
scattering image of the silver nanowires deposited on the cover glass. Scale bar 5 μm; c extinction
(full lines) and emission (dashed lines) spectra of solutions of donor molecules (PtOEP, red),
acceptor molecules (DPA, black) and of suspension of silver nanowires (blue); d microscopic image
of phosphorescence from donor molecules in the hybrid sample obtained with 532 nm excitation
laser; scale bar 2 μm; e image of upconversion emission from acceptor molecules in the hybrid
sample obtained with 532 nm excitation laser; scale bar 2 μm; f 1D intensity profiles along the long
axis of the nanowire of upconversion emission (black symbols) and phosphorescence (red symbols);
the profiles were taken along a cross section indicated by yellow line in (d) and (e). Reprinted with
permission from J. Phys. Chem. C 121:25479–25486 (2017). Copyright 2017 American Chemical
Society
529
DPA
PtOEP
Ag NW
400
500
600
700
Luminescence (a.u.)
Normalized extinction
Wavelength (nm)
c
b
e
d Phosphorescence
Upconversion
f
Upconversion
Phosphoresc.
1.0 1.5 2.0 2.5 3.0 3.5 4.0 4.5
Intensity (a.u.)
Distance (µm)
donor: PtOEP
acceptor: DPA
PMMA film
Ag NW
plasmonic hot spot
a
Fig. 30.6 a Scheme of the sample structure prepared on a microscope cover glass; b dark-field
scattering image of the silver nanowires deposited on the cover glass. Scale bar 5 μm; c extinction
(full lines) and emission (dashed lines) spectra of solutions of donor molecules (PtOEP, red),
acceptor molecules (DPA, black) and of suspension of silver nanowires (blue); d microscopic image
of phosphorescence from donor molecules in the hybrid sample obtained with 532 nm excitation
laser; scale bar 2 μm; e image of upconversion emission from acceptor molecules in the hybrid
sample obtained with 532 nm excitation laser; scale bar 2 μm; f 1D intensity profiles along the long
axis of the nanowire of upconversion emission (black symbols) and phosphorescence (red symbols);
the profiles were taken along a cross section indicated by yellow line in (d) and (e). Reprinted with
permission from J. Phys. Chem. C 121:25479–25486 (2017). Copyright 2017 American Chemical
Society