

526
M. Vacha and S. Hirata
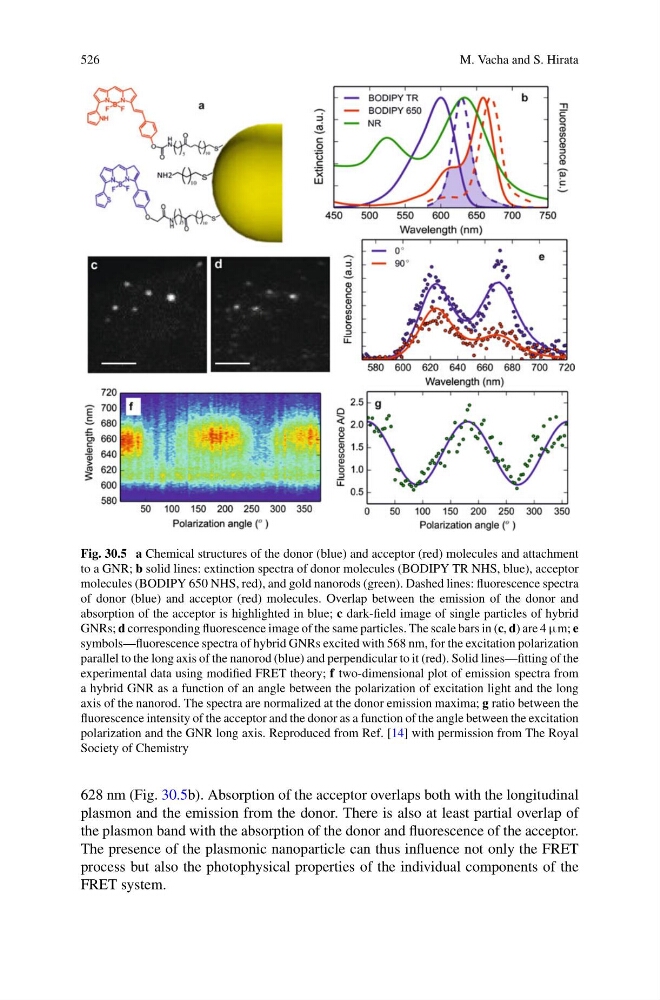
Fig. 30.5 a Chemical structures of the donor (blue) and acceptor (red) molecules and attachment
to a GNR; b solid lines: extinction spectra of donor molecules (BODIPY TR NHS, blue), acceptor
molecules (BODIPY 650 NHS, red), and gold nanorods (green). Dashed lines: fluorescence spectra
of donor (blue) and acceptor (red) molecules. Overlap between the emission of the donor and
absorption of the acceptor is highlighted in blue; c dark-field image of single particles of hybrid
GNRs; d corresponding fluorescence image of the same particles. The scale bars in (c, d) are 4 μm; e
symbols—fluorescence spectra of hybrid GNRs excited with 568 nm, for the excitation polarization
parallel to the long axis of the nanorod (blue) and perpendicular to it (red). Solid lines—fitting of the
experimental data using modified FRET theory; f two-dimensional plot of emission spectra from
a hybrid GNR as a function of an angle between the polarization of excitation light and the long
axis of the nanorod. The spectra are normalized at the donor emission maxima; g ratio between the
fluorescence intensity of the acceptor and the donor as a function of the angle between the excitation
polarization and the GNR long axis. Reproduced from Ref. [14] with permission from The Royal
Society of Chemistry
628 nm (Fig. 30.5b). Absorption of the acceptor overlaps both with the longitudinal
plasmon and the emission from the donor. There is also at least partial overlap of
the plasmon band with the absorption of the donor and fluorescence of the acceptor.
The presence of the plasmonic nanoparticle can thus influence not only the FRET
process but also the photophysical properties of the individual components of the
FRET system.
M. Vacha and S. Hirata
Fig. 30.5 a Chemical structures of the donor (blue) and acceptor (red) molecules and attachment
to a GNR; b solid lines: extinction spectra of donor molecules (BODIPY TR NHS, blue), acceptor
molecules (BODIPY 650 NHS, red), and gold nanorods (green). Dashed lines: fluorescence spectra
of donor (blue) and acceptor (red) molecules. Overlap between the emission of the donor and
absorption of the acceptor is highlighted in blue; c dark-field image of single particles of hybrid
GNRs; d corresponding fluorescence image of the same particles. The scale bars in (c, d) are 4 μm; e
symbols—fluorescence spectra of hybrid GNRs excited with 568 nm, for the excitation polarization
parallel to the long axis of the nanorod (blue) and perpendicular to it (red). Solid lines—fitting of the
experimental data using modified FRET theory; f two-dimensional plot of emission spectra from
a hybrid GNR as a function of an angle between the polarization of excitation light and the long
axis of the nanorod. The spectra are normalized at the donor emission maxima; g ratio between the
fluorescence intensity of the acceptor and the donor as a function of the angle between the excitation
polarization and the GNR long axis. Reproduced from Ref. [14] with permission from The Royal
Society of Chemistry
628 nm (Fig. 30.5b). Absorption of the acceptor overlaps both with the longitudinal
plasmon and the emission from the donor. There is also at least partial overlap of
the plasmon band with the absorption of the donor and fluorescence of the acceptor.
The presence of the plasmonic nanoparticle can thus influence not only the FRET
process but also the photophysical properties of the individual components of the
FRET system.