

30 Single-Molecule Level Study and Control …
523
For the single-particle characterization, we used (AgIn) x Zn 2(1−x) S 2 NCs with three
different compositions that vary in the amount of Zn, i.e., x = 0.3, 0.7 and 1.0,
respectively. With increasing Zn content, the solution absorption and PL spectra
exhibit a blue shift from 1.50 to 2.06 eV, with linewidths between 415 and 440 meV.
Single-particle PL spectroscopy reveals that both the transition energies and spectral
shapes vary from particle to particle, confirming the inhomogeneous nature of the
ensemble PL band. In particular, the single NC spectral linewidths (FWHM) of 230–
300 meV are narrower than the ensemble PL for all three compositions but still reach
55–75% of the ensemble PL spectral widths. These large homogeneous linewidths
are more than three times broader than those of II-VI semiconductor (CdSe) NCs. To
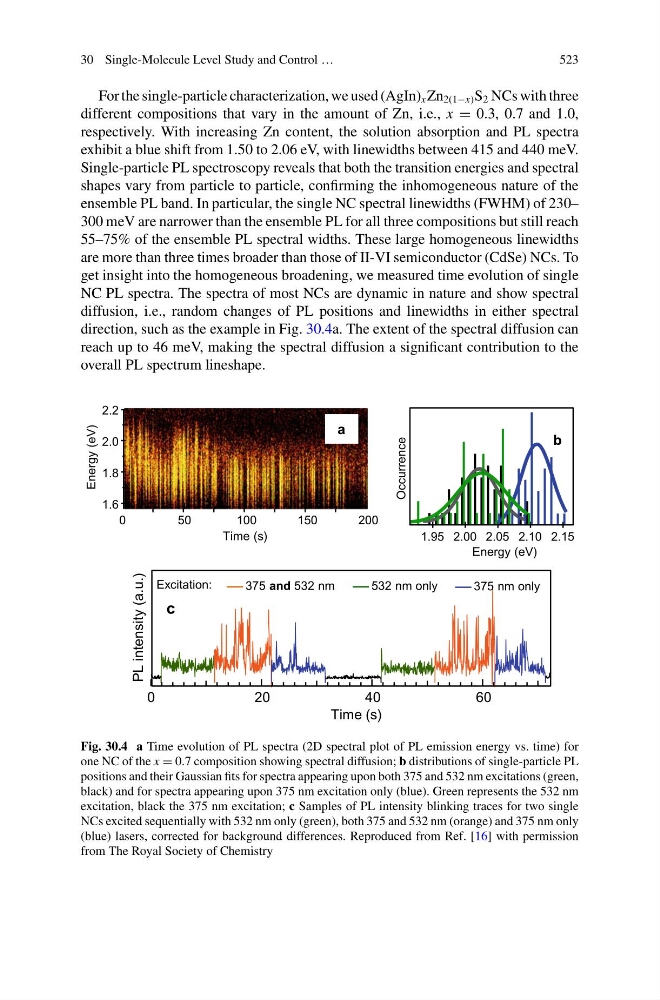
get insight into the homogeneous broadening, we measured time evolution of single
NC PL spectra. The spectra of most NCs are dynamic in nature and show spectral
diffusion, i.e., random changes of PL positions and linewidths in either spectral
direction, such as the example in Fig. 30.4a. The extent of the spectral diffusion can
reach up to 46 meV, making the spectral diffusion a significant contribution to the
overall PL spectrum lineshape.
0
50
100
150
200
Time (s)
Energy (eV)
a
1.6
1.8
2.0
2.2
2.15
2.10
2.05
2.00
1.95
Energy (eV)
Occurrence
b
60
40
20
0
Time (s)
PL intensity (a.u.)
375 and 532 nm
Excitation:
532 nm only
375 nm only
c
Fig. 30.4 a Time evolution of PL spectra (2D spectral plot of PL emission energy vs. time) for
one NC of the x = 0.7 composition showing spectral diffusion; b distributions of single-particle PL
positions and their Gaussian fits for spectra appearing upon both 375 and 532 nm excitations (green,
black) and for spectra appearing upon 375 nm excitation only (blue). Green represents the 532 nm
excitation, black the 375 nm excitation; c Samples of PL intensity blinking traces for two single
NCs excited sequentially with 532 nm only (green), both 375 and 532 nm (orange) and 375 nm only
(blue) lasers, corrected for background differences. Reproduced from Ref. [16] with permission
from The Royal Society of Chemistry
523
For the single-particle characterization, we used (AgIn) x Zn 2(1−x) S 2 NCs with three
different compositions that vary in the amount of Zn, i.e., x = 0.3, 0.7 and 1.0,
respectively. With increasing Zn content, the solution absorption and PL spectra
exhibit a blue shift from 1.50 to 2.06 eV, with linewidths between 415 and 440 meV.
Single-particle PL spectroscopy reveals that both the transition energies and spectral
shapes vary from particle to particle, confirming the inhomogeneous nature of the
ensemble PL band. In particular, the single NC spectral linewidths (FWHM) of 230–
300 meV are narrower than the ensemble PL for all three compositions but still reach
55–75% of the ensemble PL spectral widths. These large homogeneous linewidths
are more than three times broader than those of II-VI semiconductor (CdSe) NCs. To
get insight into the homogeneous broadening, we measured time evolution of single
NC PL spectra. The spectra of most NCs are dynamic in nature and show spectral
diffusion, i.e., random changes of PL positions and linewidths in either spectral
direction, such as the example in Fig. 30.4a. The extent of the spectral diffusion can
reach up to 46 meV, making the spectral diffusion a significant contribution to the
overall PL spectrum lineshape.
0
50
100
150
200
Time (s)
Energy (eV)
a
1.6
1.8
2.0
2.2
2.15
2.10
2.05
2.00
1.95
Energy (eV)
Occurrence
b
60
40
20
0
Time (s)
PL intensity (a.u.)
375 and 532 nm
Excitation:
532 nm only
375 nm only
c
Fig. 30.4 a Time evolution of PL spectra (2D spectral plot of PL emission energy vs. time) for
one NC of the x = 0.7 composition showing spectral diffusion; b distributions of single-particle PL
positions and their Gaussian fits for spectra appearing upon both 375 and 532 nm excitations (green,
black) and for spectra appearing upon 375 nm excitation only (blue). Green represents the 532 nm
excitation, black the 375 nm excitation; c Samples of PL intensity blinking traces for two single
NCs excited sequentially with 532 nm only (green), both 375 and 532 nm (orange) and 375 nm only
(blue) lasers, corrected for background differences. Reproduced from Ref. [16] with permission
from The Royal Society of Chemistry