

510
Y. Ishibashi and T. Asahi
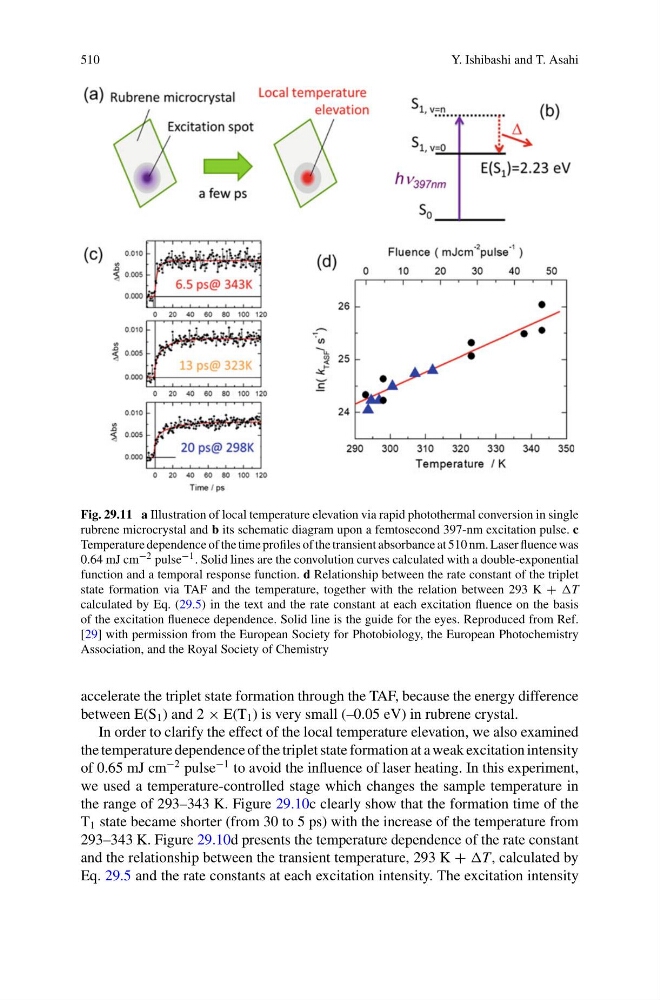
Fig. 29.11 a Illustration of local temperature elevation via rapid photothermal conversion in single
rubrene microcrystal and b its schematic diagram upon a femtosecond 397-nm excitation pulse. c
Temperature dependence of the time profiles of the transient absorbance at 510 nm. Laser fluence was
0.64 mJ cm −2 pulse −1 . Solid lines are the convolution curves calculated with a double-exponential
function and a temporal response function. d Relationship between the rate constant of the triplet
state formation via TAF and the temperature, together with the relation between 293 K + T
calculated by Eq. (29.5) in the text and the rate constant at each excitation fluence on the basis
of the excitation fluenece dependence. Solid line is the guide for the eyes. Reproduced from Ref.
[29] with permission from the European Society for Photobiology, the European Photochemistry
Association, and the Royal Society of Chemistry
accelerate the triplet state formation through the TAF, because the energy difference
between E(S 1 ) and 2 × E(T 1 ) is very small (–0.05 eV) in rubrene crystal.
In order to clarify the effect of the local temperature elevation, we also examined
the temperature dependence of the triplet state formation at a weak excitation intensity
of 0.65 mJ cm
−2 pulse
−1 to avoid the influence of laser heating. In this experiment,
we used a temperature-controlled stage which changes the sample temperature in
the range of 293–343 K. Figure 29.10c clearly show that the formation time of the
T 1 state became shorter (from 30 to 5 ps) with the increase of the temperature from
293–343 K. Figure 29.10d presents the temperature dependence of the rate constant
and the relationship between the transient temperature, 293 K + T, calculated by
Eq. 29.5 and the rate constants at each excitation intensity. The excitation intensity
Y. Ishibashi and T. Asahi
Fig. 29.11 a Illustration of local temperature elevation via rapid photothermal conversion in single
rubrene microcrystal and b its schematic diagram upon a femtosecond 397-nm excitation pulse. c
Temperature dependence of the time profiles of the transient absorbance at 510 nm. Laser fluence was
0.64 mJ cm −2 pulse −1 . Solid lines are the convolution curves calculated with a double-exponential
function and a temporal response function. d Relationship between the rate constant of the triplet
state formation via TAF and the temperature, together with the relation between 293 K + T
calculated by Eq. (29.5) in the text and the rate constant at each excitation fluence on the basis
of the excitation fluenece dependence. Solid line is the guide for the eyes. Reproduced from Ref.
[29] with permission from the European Society for Photobiology, the European Photochemistry
Association, and the Royal Society of Chemistry
accelerate the triplet state formation through the TAF, because the energy difference
between E(S 1 ) and 2 × E(T 1 ) is very small (–0.05 eV) in rubrene crystal.
In order to clarify the effect of the local temperature elevation, we also examined
the temperature dependence of the triplet state formation at a weak excitation intensity
of 0.65 mJ cm
−2 pulse
−1 to avoid the influence of laser heating. In this experiment,
we used a temperature-controlled stage which changes the sample temperature in
the range of 293–343 K. Figure 29.10c clearly show that the formation time of the
T 1 state became shorter (from 30 to 5 ps) with the increase of the temperature from
293–343 K. Figure 29.10d presents the temperature dependence of the rate constant
and the relationship between the transient temperature, 293 K + T, calculated by
Eq. 29.5 and the rate constants at each excitation intensity. The excitation intensity