

29 Femtosecond Pump-Probe Microspectroscopy …
495
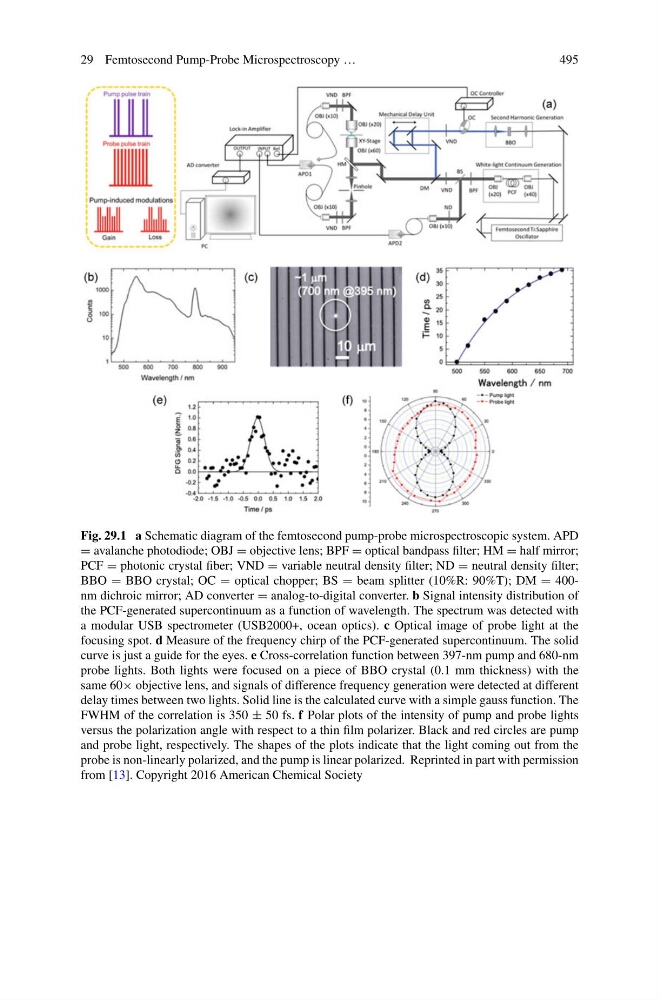
Fig. 29.1 a Schematic diagram of the femtosecond pump-probe microspectroscopic system. APD
= avalanche photodiode; OBJ = objective lens; BPF = optical bandpass filter; HM = half mirror;
PCF = photonic crystal fiber; VND = variable neutral density filter; ND = neutral density filter;
BBO = BBO crystal; OC = optical chopper; BS = beam splitter (10%R: 90%T); DM = 400nm dichroic mirror; AD converter = analog-to-digital converter. b Signal intensity distribution of
the PCF-generated supercontinuum as a function of wavelength. The spectrum was detected with
a modular USB spectrometer (USB2000+, ocean optics). c Optical image of probe light at the
focusing spot. d Measure of the frequency chirp of the PCF-generated supercontinuum. The solid
curve is just a guide for the eyes. e Cross-correlation function between 397-nm pump and 680-nm
probe lights. Both lights were focused on a piece of BBO crystal (0.1 mm thickness) with the
same 60× objective lens, and signals of difference frequency generation were detected at different
delay times between two lights. Solid line is the calculated curve with a simple gauss function. The
FWHM of the correlation is 350 ± 50 fs. f Polar plots of the intensity of pump and probe lights
versus the polarization angle with respect to a thin film polarizer. Black and red circles are pump
and probe light, respectively. The shapes of the plots indicate that the light coming out from the
probe is non-linearly polarized, and the pump is linear polarized. Reprinted in part with permission
from [13]. Copyright 2016 American Chemical Society
495
Fig. 29.1 a Schematic diagram of the femtosecond pump-probe microspectroscopic system. APD
= avalanche photodiode; OBJ = objective lens; BPF = optical bandpass filter; HM = half mirror;
PCF = photonic crystal fiber; VND = variable neutral density filter; ND = neutral density filter;
BBO = BBO crystal; OC = optical chopper; BS = beam splitter (10%R: 90%T); DM = 400nm dichroic mirror; AD converter = analog-to-digital converter. b Signal intensity distribution of
the PCF-generated supercontinuum as a function of wavelength. The spectrum was detected with
a modular USB spectrometer (USB2000+, ocean optics). c Optical image of probe light at the
focusing spot. d Measure of the frequency chirp of the PCF-generated supercontinuum. The solid
curve is just a guide for the eyes. e Cross-correlation function between 397-nm pump and 680-nm
probe lights. Both lights were focused on a piece of BBO crystal (0.1 mm thickness) with the
same 60× objective lens, and signals of difference frequency generation were detected at different
delay times between two lights. Solid line is the calculated curve with a simple gauss function. The
FWHM of the correlation is 350 ± 50 fs. f Polar plots of the intensity of pump and probe lights
versus the polarization angle with respect to a thin film polarizer. Black and red circles are pump
and probe light, respectively. The shapes of the plots indicate that the light coming out from the
probe is non-linearly polarized, and the pump is linear polarized. Reprinted in part with permission
from [13]. Copyright 2016 American Chemical Society