

418
K. Uchida et al.
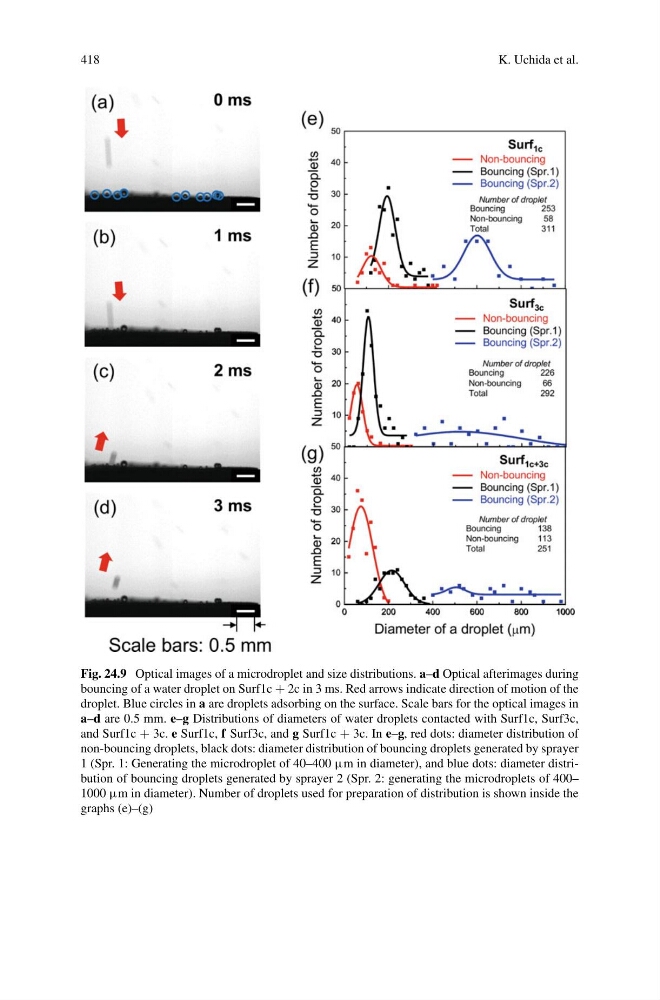
Fig. 24.9 Optical images of a microdroplet and size distributions. a–d Optical afterimages during
bouncing of a water droplet on Surf1c + 2c in 3 ms. Red arrows indicate direction of motion of the
droplet. Blue circles in a are droplets adsorbing on the surface. Scale bars for the optical images in
a–d are 0.5 mm. e–g Distributions of diameters of water droplets contacted with Surf1c, Surf3c,
and Surf1c + 3c. e Surf1c, f Surf3c, and g Surf1c + 3c. In e–g, red dots: diameter distribution of
non-bouncing droplets, black dots: diameter distribution of bouncing droplets generated by sprayer
1 (Spr. 1: Generating the microdroplet of 40–400 µm in diameter), and blue dots: diameter distribution of bouncing droplets generated by sprayer 2 (Spr. 2: generating the microdroplets of 400–
1000 µm in diameter). Number of droplets used for preparation of distribution is shown inside the
graphs (e)–(g)
K. Uchida et al.
Fig. 24.9 Optical images of a microdroplet and size distributions. a–d Optical afterimages during
bouncing of a water droplet on Surf1c + 2c in 3 ms. Red arrows indicate direction of motion of the
droplet. Blue circles in a are droplets adsorbing on the surface. Scale bars for the optical images in
a–d are 0.5 mm. e–g Distributions of diameters of water droplets contacted with Surf1c, Surf3c,
and Surf1c + 3c. e Surf1c, f Surf3c, and g Surf1c + 3c. In e–g, red dots: diameter distribution of
non-bouncing droplets, black dots: diameter distribution of bouncing droplets generated by sprayer
1 (Spr. 1: Generating the microdroplet of 40–400 µm in diameter), and blue dots: diameter distribution of bouncing droplets generated by sprayer 2 (Spr. 2: generating the microdroplets of 400–
1000 µm in diameter). Number of droplets used for preparation of distribution is shown inside the
graphs (e)–(g)