

18 π-Electronic Ion-Pairing Assemblies …
313
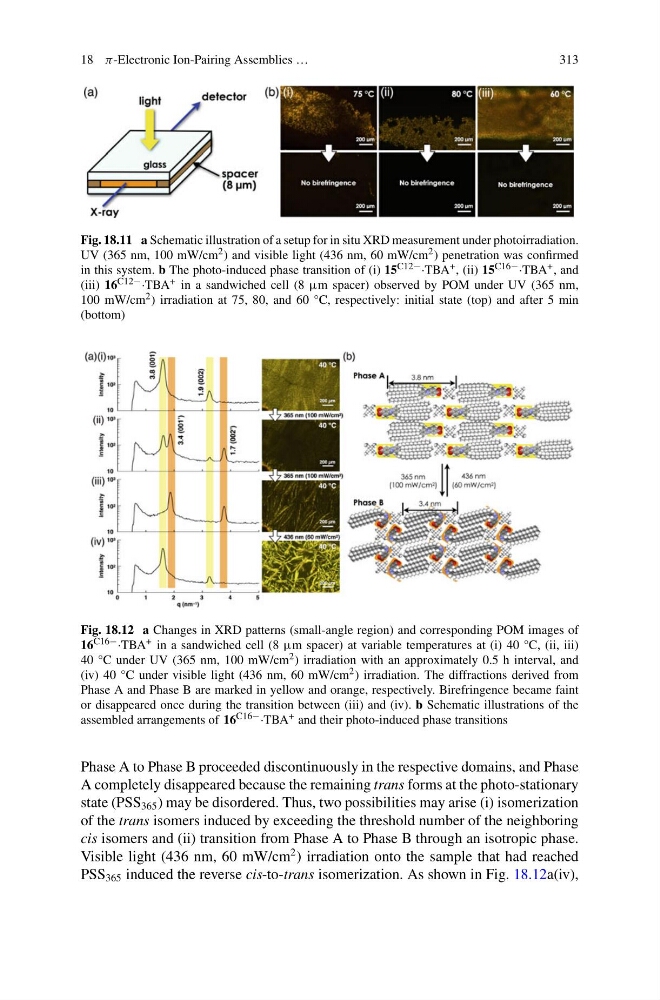
Fig. 18.11 a Schematic illustration of a setup for in situ XRD measurement under photoirradiation.
UV (365 nm, 100 mW/cm 2 ) and visible light (436 nm, 60 mW/cm 2 ) penetration was confirmed
in this system. b The photo-induced phase transition of (i) 15 C12− ·TBA + , (ii) 15 C16− ·TBA + , and
(iii) 16 C12− ·TBA + in a sandwiched cell (8 μm spacer) observed by POM under UV (365 nm,
100 mW/cm 2 ) irradiation at 75, 80, and 60 °C, respectively: initial state (top) and after 5 min
(bottom)
Fig. 18.12 a Changes in XRD patterns (small-angle region) and corresponding POM images of
16 C16− ·TBA + in a sandwiched cell (8 μm spacer) at variable temperatures at (i) 40 °C, (ii, iii)
40 °C under UV (365 nm, 100 mW/cm 2 ) irradiation with an approximately 0.5 h interval, and
(iv) 40 °C under visible light (436 nm, 60 mW/cm 2 ) irradiation. The diffractions derived from
Phase A and Phase B are marked in yellow and orange, respectively. Birefringence became faint
or disappeared once during the transition between (iii) and (iv). b Schematic illustrations of the
assembled arrangements of 16 C16− ·TBA + and their photo-induced phase transitions
Phase A to Phase B proceeded discontinuously in the respective domains, and Phase
A completely disappeared because the remaining trans forms at the photo-stationary
state (PSS 365 ) may be disordered. Thus, two possibilities may arise (i) isomerization
of the trans isomers induced by exceeding the threshold number of the neighboring
cis isomers and (ii) transition from Phase A to Phase B through an isotropic phase.
Visible light (436 nm, 60 mW/cm
2 ) irradiation onto the sample that had reached
PSS 365 induced the reverse cis-to-trans isomerization. As shown in Fig. 18.12a(iv),
313
Fig. 18.11 a Schematic illustration of a setup for in situ XRD measurement under photoirradiation.
UV (365 nm, 100 mW/cm 2 ) and visible light (436 nm, 60 mW/cm 2 ) penetration was confirmed
in this system. b The photo-induced phase transition of (i) 15 C12− ·TBA + , (ii) 15 C16− ·TBA + , and
(iii) 16 C12− ·TBA + in a sandwiched cell (8 μm spacer) observed by POM under UV (365 nm,
100 mW/cm 2 ) irradiation at 75, 80, and 60 °C, respectively: initial state (top) and after 5 min
(bottom)
Fig. 18.12 a Changes in XRD patterns (small-angle region) and corresponding POM images of
16 C16− ·TBA + in a sandwiched cell (8 μm spacer) at variable temperatures at (i) 40 °C, (ii, iii)
40 °C under UV (365 nm, 100 mW/cm 2 ) irradiation with an approximately 0.5 h interval, and
(iv) 40 °C under visible light (436 nm, 60 mW/cm 2 ) irradiation. The diffractions derived from
Phase A and Phase B are marked in yellow and orange, respectively. Birefringence became faint
or disappeared once during the transition between (iii) and (iv). b Schematic illustrations of the
assembled arrangements of 16 C16− ·TBA + and their photo-induced phase transitions
Phase A to Phase B proceeded discontinuously in the respective domains, and Phase
A completely disappeared because the remaining trans forms at the photo-stationary
state (PSS 365 ) may be disordered. Thus, two possibilities may arise (i) isomerization
of the trans isomers induced by exceeding the threshold number of the neighboring
cis isomers and (ii) transition from Phase A to Phase B through an isotropic phase.
Visible light (436 nm, 60 mW/cm
2 ) irradiation onto the sample that had reached
PSS 365 induced the reverse cis-to-trans isomerization. As shown in Fig. 18.12a(iv),