

144
K. Ueno
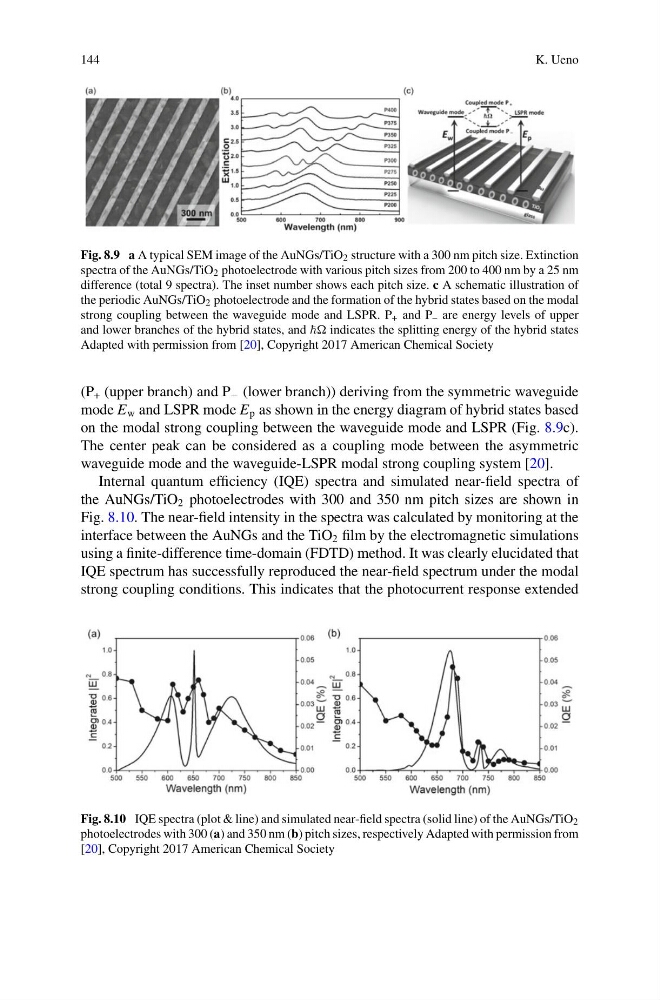
Fig. 8.9 a A typical SEM image of the AuNGs/TiO 2 structure with a 300 nm pitch size. Extinction
spectra of the AuNGs/TiO 2 photoelectrode with various pitch sizes from 200 to 400 nm by a 25 nm
difference (total 9 spectra). The inset number shows each pitch size. c A schematic illustration of
the periodic AuNGs/TiO 2 photoelectrode and the formation of the hybrid states based on the modal
strong coupling between the waveguide mode and LSPR. P + and P – are energy levels of upper
and lower branches of the hybrid states, and indicates the splitting energy of the hybrid states
Adapted with permission from [20], Copyright 2017 American Chemical Society
(P + (upper branch) and P − (lower branch)) deriving from the symmetric waveguide
mode E w and LSPR mode E p as shown in the energy diagram of hybrid states based
on the modal strong coupling between the waveguide mode and LSPR (Fig. 8.9c).
The center peak can be considered as a coupling mode between the asymmetric
waveguide mode and the waveguide-LSPR modal strong coupling system [20].
Internal quantum efficiency (IQE) spectra and simulated near-field spectra of
the AuNGs/TiO 2 photoelectrodes with 300 and 350 nm pitch sizes are shown in
Fig. 8.10. The near-field intensity in the spectra was calculated by monitoring at the
interface between the AuNGs and the TiO 2 film by the electromagnetic simulations
using a finite-difference time-domain (FDTD) method. It was clearly elucidated that
IQE spectrum has successfully reproduced the near-field spectrum under the modal
strong coupling conditions. This indicates that the photocurrent response extended
Fig. 8.10 IQE spectra (plot & line) and simulated near-field spectra (solid line) of the AuNGs/TiO 2
photoelectrodes with 300 (a) and 350 nm (b) pitch sizes, respectively Adapted with permission from
[20], Copyright 2017 American Chemical Society
K. Ueno
Fig. 8.9 a A typical SEM image of the AuNGs/TiO 2 structure with a 300 nm pitch size. Extinction
spectra of the AuNGs/TiO 2 photoelectrode with various pitch sizes from 200 to 400 nm by a 25 nm
difference (total 9 spectra). The inset number shows each pitch size. c A schematic illustration of
the periodic AuNGs/TiO 2 photoelectrode and the formation of the hybrid states based on the modal
strong coupling between the waveguide mode and LSPR. P + and P – are energy levels of upper
and lower branches of the hybrid states, and indicates the splitting energy of the hybrid states
Adapted with permission from [20], Copyright 2017 American Chemical Society
(P + (upper branch) and P − (lower branch)) deriving from the symmetric waveguide
mode E w and LSPR mode E p as shown in the energy diagram of hybrid states based
on the modal strong coupling between the waveguide mode and LSPR (Fig. 8.9c).
The center peak can be considered as a coupling mode between the asymmetric
waveguide mode and the waveguide-LSPR modal strong coupling system [20].
Internal quantum efficiency (IQE) spectra and simulated near-field spectra of
the AuNGs/TiO 2 photoelectrodes with 300 and 350 nm pitch sizes are shown in
Fig. 8.10. The near-field intensity in the spectra was calculated by monitoring at the
interface between the AuNGs and the TiO 2 film by the electromagnetic simulations
using a finite-difference time-domain (FDTD) method. It was clearly elucidated that
IQE spectrum has successfully reproduced the near-field spectrum under the modal
strong coupling conditions. This indicates that the photocurrent response extended
Fig. 8.10 IQE spectra (plot & line) and simulated near-field spectra (solid line) of the AuNGs/TiO 2
photoelectrodes with 300 (a) and 350 nm (b) pitch sizes, respectively Adapted with permission from
[20], Copyright 2017 American Chemical Society