

9 An Algorithm for Linear, Affine and Spectral Classification of Boolean Functions
197
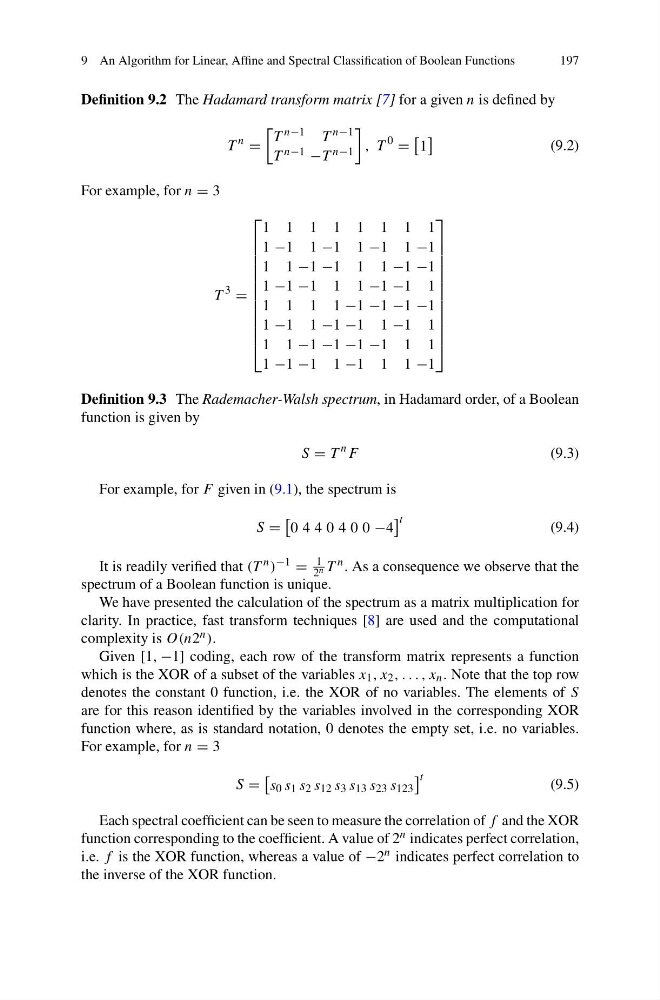
Definition 9.2 The Hadamard transform matrix [7] for a given n is defined by
T
n
=
T n−1 T n−1
T n−1 −T n−1
, T
0
=
1
(9.2)
For example, for n = 3
T
3
=
⎡
⎢
⎢
⎢
⎢
⎢
⎢
⎢
⎢
⎢
⎢
⎢
⎣
1 1 1 1 1 1 1 1
1 −1 1 −1 1 −1 1 −1
1 1 −1 −1 1 1 −1 −1
1 −1 −1 1 1 −1 −1 1
1 1 1 1 −1 −1 −1 −1
1 −1 1 −1 −1 1 −1 1
1 1 −1 −1 −1 −1 1 1
1 −1 −1 1 −1 1 1 −1
⎤
⎥
⎥
⎥
⎥
⎥
⎥
⎥
⎥
⎥
⎥
⎥
⎦
Definition 9.3 The Rademacher-Walsh spectrum, in Hadamard order, of a Boolean
function is given by
S = T
n F
(9.3)
For example, for F given in (9.1), the spectrum is
S =
0 4 4 0 4 0 0 −4
t
(9.4)
It is readily verified that (T n ) −1 =
1
2 n T n . As a consequence we observe that the
spectrum of a Boolean function is unique.
We have presented the calculation of the spectrum as a matrix multiplication for
clarity. In practice, fast transform techniques [8] are used and the computational
complexity is O(n2 n ).
Given [1, −1] coding, each row of the transform matrix represents a function
which is the XOR of a subset of the variables x 1 , x 2 , . . . , x n . Note that the top row
denotes the constant 0 function, i.e. the XOR of no variables. The elements of S
are for this reason identified by the variables involved in the corresponding XOR
function where, as is standard notation, 0 denotes the empty set, i.e. no variables.
For example, for n = 3
S =
s 0 s 1 s 2 s 12 s 3 s 13 s 23 s 123
t
(9.5)
Each spectral coefficient can be seen to measure the correlation of f and the XOR
function corresponding to the coefficient. A value of 2 n indicates perfect correlation,
i.e. f is the XOR function, whereas a value of −2 n indicates perfect correlation to
the inverse of the XOR function.
197
Definition 9.2 The Hadamard transform matrix [7] for a given n is defined by
T
n
=
T n−1 T n−1
T n−1 −T n−1
, T
0
=
1
(9.2)
For example, for n = 3
T
3
=
⎡
⎢
⎢
⎢
⎢
⎢
⎢
⎢
⎢
⎢
⎢
⎢
⎣
1 1 1 1 1 1 1 1
1 −1 1 −1 1 −1 1 −1
1 1 −1 −1 1 1 −1 −1
1 −1 −1 1 1 −1 −1 1
1 1 1 1 −1 −1 −1 −1
1 −1 1 −1 −1 1 −1 1
1 1 −1 −1 −1 −1 1 1
1 −1 −1 1 −1 1 1 −1
⎤
⎥
⎥
⎥
⎥
⎥
⎥
⎥
⎥
⎥
⎥
⎥
⎦
Definition 9.3 The Rademacher-Walsh spectrum, in Hadamard order, of a Boolean
function is given by
S = T
n F
(9.3)
For example, for F given in (9.1), the spectrum is
S =
0 4 4 0 4 0 0 −4
t
(9.4)
It is readily verified that (T n ) −1 =
1
2 n T n . As a consequence we observe that the
spectrum of a Boolean function is unique.
We have presented the calculation of the spectrum as a matrix multiplication for
clarity. In practice, fast transform techniques [8] are used and the computational
complexity is O(n2 n ).
Given [1, −1] coding, each row of the transform matrix represents a function
which is the XOR of a subset of the variables x 1 , x 2 , . . . , x n . Note that the top row
denotes the constant 0 function, i.e. the XOR of no variables. The elements of S
are for this reason identified by the variables involved in the corresponding XOR
function where, as is standard notation, 0 denotes the empty set, i.e. no variables.
For example, for n = 3
S =
s 0 s 1 s 2 s 12 s 3 s 13 s 23 s 123
t
(9.5)
Each spectral coefficient can be seen to measure the correlation of f and the XOR
function corresponding to the coefficient. A value of 2 n indicates perfect correlation,
i.e. f is the XOR function, whereas a value of −2 n indicates perfect correlation to
the inverse of the XOR function.