

156
E. C. Ferraz et al.
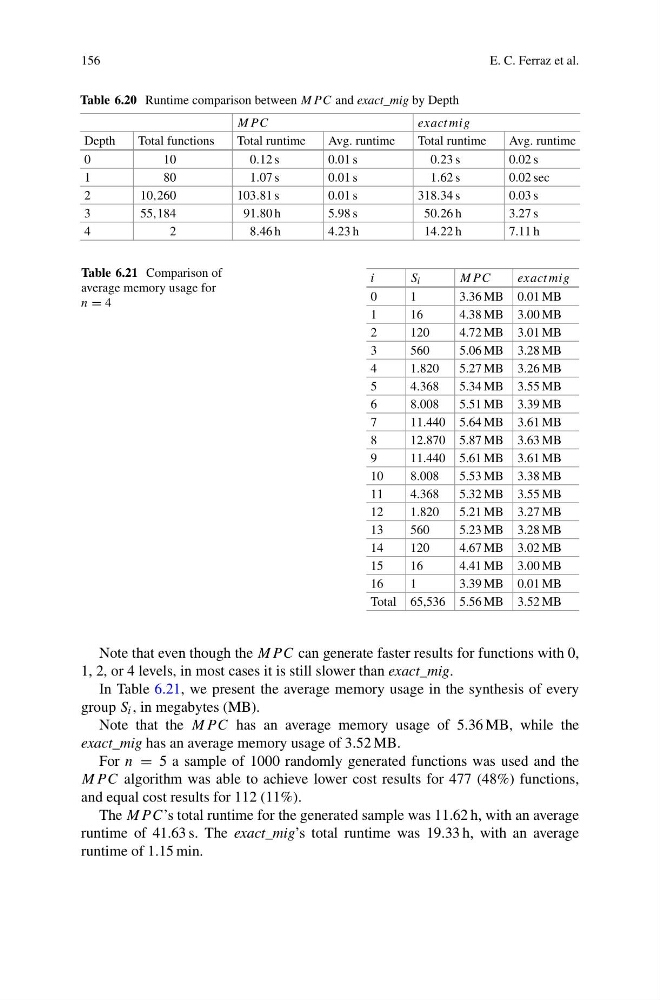
Table 6.20 Runtime comparison between MP C and exact_mig by Depth
MP C
exact mig
Depth
Total functions
Total runtime
Avg. runtime
Total runtime
Avg. runtime
0
10
0.12 s
0.01 s
0.23 s
0.02 s
1
80
1.07 s
0.01 s
1.62 s
0.02 sec
2
10,260
103.81 s
0.01 s
318.34 s
0.03 s
3
55,184
91.80 h
5.98 s
50.26 h
3.27 s
4
2
8.46 h
4.23 h
14.22 h
7.11 h
Table 6.21 Comparison of
average memory usage for
n = 4
i
S i
MP C
exact mig
0
1
3.36 MB 0.01 MB
1
16
4.38 MB 3.00 MB
2
120
4.72 MB 3.01 MB
3
560
5.06 MB 3.28 MB
4
1.820
5.27 MB 3.26 MB
5
4.368
5.34 MB 3.55 MB
6
8.008
5.51 MB 3.39 MB
7
11.440 5.64 MB 3.61 MB
8
12.870 5.87 MB 3.63 MB
9
11.440 5.61 MB 3.61 MB
10
8.008
5.53 MB 3.38 MB
11
4.368
5.32 MB 3.55 MB
12
1.820
5.21 MB 3.27 MB
13
560
5.23 MB 3.28 MB
14
120
4.67 MB 3.02 MB
15
16
4.41 MB 3.00 MB
16
1
3.39 MB 0.01 MB
Total 65,536 5.56 MB 3.52 MB
Note that even though the MP C can generate faster results for functions with 0,
1, 2, or 4 levels, in most cases it is still slower than exact_mig.
In Table 6.21, we present the average memory usage in the synthesis of every
group S i , in megabytes (MB).
Note that the MP C has an average memory usage of 5.36 MB, while the
exact_mig has an average memory usage of 3.52 MB.
For n = 5 a sample of 1000 randomly generated functions was used and the
MP C algorithm was able to achieve lower cost results for 477 (48%) functions,
and equal cost results for 112 (11%).
The MP C’s total runtime for the generated sample was 11.62 h, with an average
runtime of 41.63 s. The exact_mig’s total runtime was 19.33 h, with an average
runtime of 1.15 min.
E. C. Ferraz et al.
Table 6.20 Runtime comparison between MP C and exact_mig by Depth
MP C
exact mig
Depth
Total functions
Total runtime
Avg. runtime
Total runtime
Avg. runtime
0
10
0.12 s
0.01 s
0.23 s
0.02 s
1
80
1.07 s
0.01 s
1.62 s
0.02 sec
2
10,260
103.81 s
0.01 s
318.34 s
0.03 s
3
55,184
91.80 h
5.98 s
50.26 h
3.27 s
4
2
8.46 h
4.23 h
14.22 h
7.11 h
Table 6.21 Comparison of
average memory usage for
n = 4
i
S i
MP C
exact mig
0
1
3.36 MB 0.01 MB
1
16
4.38 MB 3.00 MB
2
120
4.72 MB 3.01 MB
3
560
5.06 MB 3.28 MB
4
1.820
5.27 MB 3.26 MB
5
4.368
5.34 MB 3.55 MB
6
8.008
5.51 MB 3.39 MB
7
11.440 5.64 MB 3.61 MB
8
12.870 5.87 MB 3.63 MB
9
11.440 5.61 MB 3.61 MB
10
8.008
5.53 MB 3.38 MB
11
4.368
5.32 MB 3.55 MB
12
1.820
5.21 MB 3.27 MB
13
560
5.23 MB 3.28 MB
14
120
4.67 MB 3.02 MB
15
16
4.41 MB 3.00 MB
16
1
3.39 MB 0.01 MB
Total 65,536 5.56 MB 3.52 MB
Note that even though the MP C can generate faster results for functions with 0,
1, 2, or 4 levels, in most cases it is still slower than exact_mig.
In Table 6.21, we present the average memory usage in the synthesis of every
group S i , in megabytes (MB).
Note that the MP C has an average memory usage of 5.36 MB, while the
exact_mig has an average memory usage of 3.52 MB.
For n = 5 a sample of 1000 randomly generated functions was used and the
MP C algorithm was able to achieve lower cost results for 477 (48%) functions,
and equal cost results for 112 (11%).
The MP C’s total runtime for the generated sample was 11.62 h, with an average
runtime of 41.63 s. The exact_mig’s total runtime was 19.33 h, with an average
runtime of 1.15 min.