

Pressure (kPa)
120,000
100,000
80,000
60,000
40,000
20,000
0
Methane
hydrate
and ice
Methane
hydrate
in water
Methane
gas
in water
−15 −14 −12 −9 −6 −3 2 8 10 12 15 16 17 18 19 21 23 26 28 30 33
Temperature (°C)
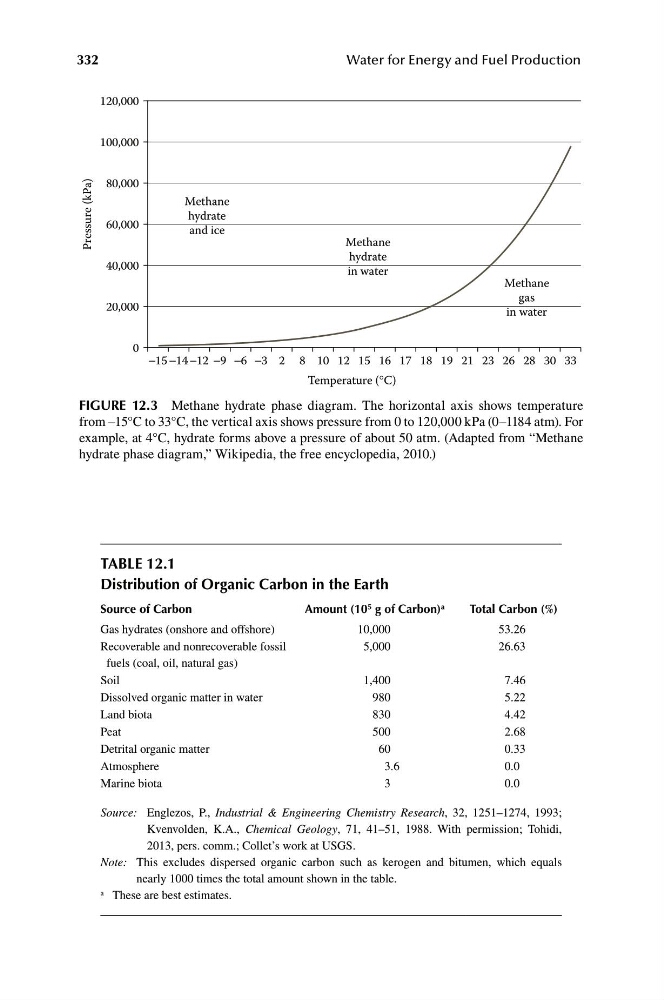
FiGUre 12.3 Methane hydrate phase diagram. The horizontal axis shows temperature
from –15°C to 33°C, the vertical axis shows pressure from 0 to 120,000 kPa (0–1184 atm). For
example, at 4°C, hydrate forms above a pressure of about 50 atm. (Adapted from “Methane
hydrate phase diagram,” Wikipedia, the free encyclopedia, 2010.)
332
Water for Energy and Fuel Production
taBle 12.1
distribution of Organic Carbon in the earth
source of Carbon
amount (10 5 g of Carbon) a
total Carbon (%)
Gas hydrates (onshore and offshore)
10,000
53.26
Recoverable and nonrecoverable fossil
5,000
26.63
fuels (coal, oil, natural gas)
Soil
1,400
7.46
Dissolved organic matter in water
980
5.22
Land biota
830
4.42
Peat
500
2.68
Detrital organic matter
60
0.33
Atmosphere
3.6
0.0
Marine biota
3
0.0
Source: Englezos, P., Industrial & Engineering Chemistry Research, 32, 1251–1274, 1993;
Kvenvolden, K.A., Chemical Geology, 71, 41–51, 1988. With permission; Tohidi,
2013, pers. comm.; Collet’s work at USGS.
Note: This excludes dispersed organic carbon such as kerogen and bitumen, which equals
nearly 1000 times the total amount shown in the table.
a These are best estimates.
120,000
100,000
80,000
60,000
40,000
20,000
0
Methane
hydrate
and ice
Methane
hydrate
in water
Methane
gas
in water
−15 −14 −12 −9 −6 −3 2 8 10 12 15 16 17 18 19 21 23 26 28 30 33
Temperature (°C)
FiGUre 12.3 Methane hydrate phase diagram. The horizontal axis shows temperature
from –15°C to 33°C, the vertical axis shows pressure from 0 to 120,000 kPa (0–1184 atm). For
example, at 4°C, hydrate forms above a pressure of about 50 atm. (Adapted from “Methane
hydrate phase diagram,” Wikipedia, the free encyclopedia, 2010.)
332
Water for Energy and Fuel Production
taBle 12.1
distribution of Organic Carbon in the earth
source of Carbon
amount (10 5 g of Carbon) a
total Carbon (%)
Gas hydrates (onshore and offshore)
10,000
53.26
Recoverable and nonrecoverable fossil
5,000
26.63
fuels (coal, oil, natural gas)
Soil
1,400
7.46
Dissolved organic matter in water
980
5.22
Land biota
830
4.42
Peat
500
2.68
Detrital organic matter
60
0.33
Atmosphere
3.6
0.0
Marine biota
3
0.0
Source: Englezos, P., Industrial & Engineering Chemistry Research, 32, 1251–1274, 1993;
Kvenvolden, K.A., Chemical Geology, 71, 41–51, 1988. With permission; Tohidi,
2013, pers. comm.; Collet’s work at USGS.
Note: This excludes dispersed organic carbon such as kerogen and bitumen, which equals
nearly 1000 times the total amount shown in the table.
a These are best estimates.