

16,000
14,000
12,000
Wave
10,000
Tidal barrage
Tidal
8,000
River hydrokinetic
OTEC
6,000
Ocean current
4,000
2,000
0
2009
2010
2011
2012
2013
2014
2015
Capacity (MW)
Electricity
Sun
Mariculture
Nori
Abalone
Clams
Oysters
Lobsters
Shrimp
Salmon
Steelhead
trout
Desalinated water
Drinking
Irrigation
Cold-water discharge
Kelp
Phytoplankton
Zooplankton
Cold-water
refrigeration
OTEC
Cold water
Building
airconditioning
Warm water
Air-conditioning
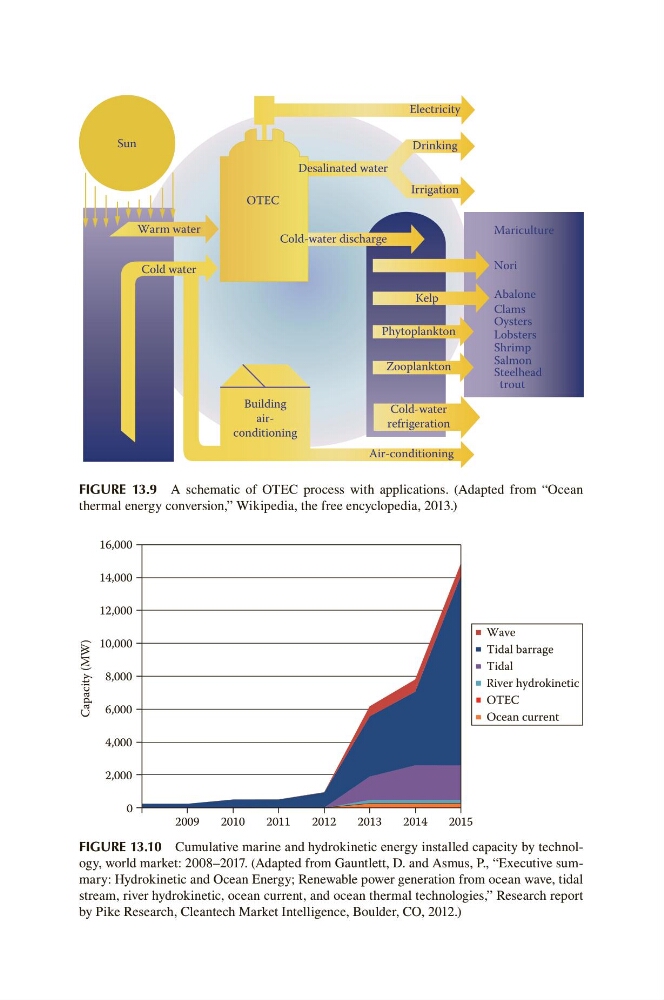
FIGURE 13.9 A schematic of OTEC process with applications. (Adapted from “Ocean
thermal energy conversion,” Wikipedia, the free encyclopedia, 2013.)
FIGURE 13.10 Cumulative marine and hydrokinetic energy installed capacity by technology, world market: 2008–2017. (Adapted from Gauntlett, D. and Asmus, P., “Executive summary: Hydrokinetic and Ocean Energy; Renewable power generation from ocean wave, tidal
stream, river hydrokinetic, ocean current, and ocean thermal technologies,” Research report
by Pike Research, Cleantech Market Intelligence, Boulder, CO, 2012.)
14,000
12,000
Wave
10,000
Tidal barrage
Tidal
8,000
River hydrokinetic
OTEC
6,000
Ocean current
4,000
2,000
0
2009
2010
2011
2012
2013
2014
2015
Capacity (MW)
Electricity
Sun
Mariculture
Nori
Abalone
Clams
Oysters
Lobsters
Shrimp
Salmon
Steelhead
trout
Desalinated water
Drinking
Irrigation
Cold-water discharge
Kelp
Phytoplankton
Zooplankton
Cold-water
refrigeration
OTEC
Cold water
Building
airconditioning
Warm water
Air-conditioning
FIGURE 13.9 A schematic of OTEC process with applications. (Adapted from “Ocean
thermal energy conversion,” Wikipedia, the free encyclopedia, 2013.)
FIGURE 13.10 Cumulative marine and hydrokinetic energy installed capacity by technology, world market: 2008–2017. (Adapted from Gauntlett, D. and Asmus, P., “Executive summary: Hydrokinetic and Ocean Energy; Renewable power generation from ocean wave, tidal
stream, river hydrokinetic, ocean current, and ocean thermal technologies,” Research report
by Pike Research, Cleantech Market Intelligence, Boulder, CO, 2012.)