

Therefore, the mission reliability for networked System can be calculated using the
following expressions:
MRðtÞ ¼ a
n e
ÀkðtÀ
P n
i¼0
T PM ðiÞÞ
;
X n
i¼1
T PMðiÞ \t
ð18:4Þ
MR
X n
i¼1
T PM ðiÞ
!
¼ MR 0
ð18:5Þ
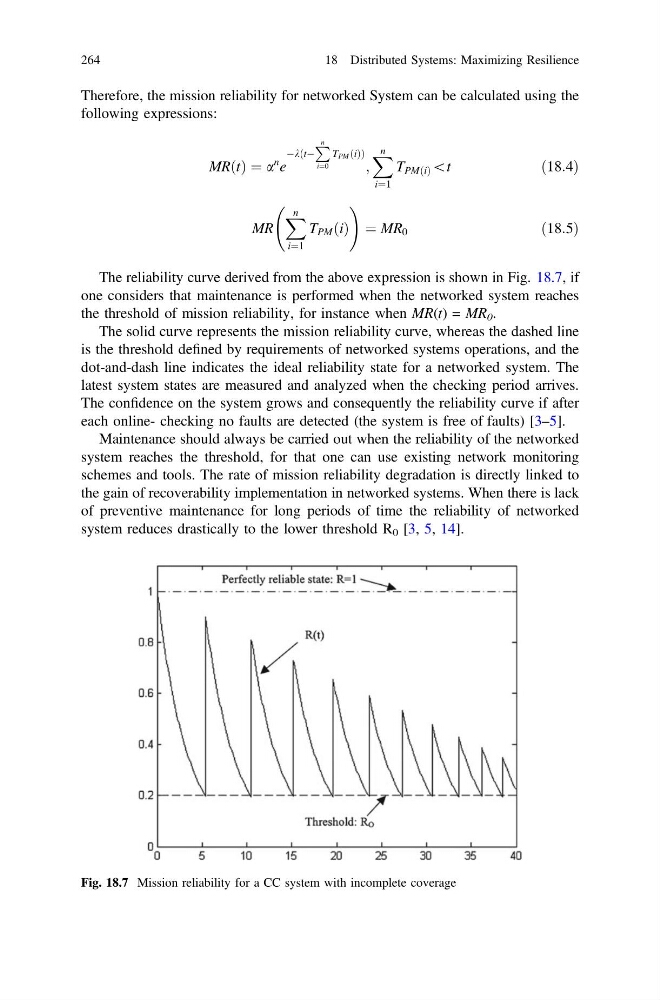
The reliability curve derived from the above expression is shown in Fig. 18.7, if
one considers that maintenance is performed when the networked system reaches
the threshold of mission reliability, for instance when MR(t) = MR 0 .
The solid curve represents the mission reliability curve, whereas the dashed line
is the threshold defined by requirements of networked systems operations, and the
dot-and-dash line indicates the ideal reliability state for a networked system. The
latest system states are measured and analyzed when the checking period arrives.
The confidence on the system grows and consequently the reliability curve if after
each online- checking no faults are detected (the system is free of faults) [3–5].
Maintenance should always be carried out when the reliability of the networked
system reaches the threshold, for that one can use existing network monitoring
schemes and tools. The rate of mission reliability degradation is directly linked to
the gain of recoverability implementation in networked systems. When there is lack
of preventive maintenance for long periods of time the reliability of networked
system reduces drastically to the lower threshold R 0 [3, 5, 14].
Fig. 18.7 Mission reliability for a CC system with incomplete coverage
264
18 Distributed Systems: Maximizing Resilience
following expressions:
MRðtÞ ¼ a
n e
ÀkðtÀ
P n
i¼0
T PM ðiÞÞ
;
X n
i¼1
T PMðiÞ \t
ð18:4Þ
MR
X n
i¼1
T PM ðiÞ
!
¼ MR 0
ð18:5Þ
The reliability curve derived from the above expression is shown in Fig. 18.7, if
one considers that maintenance is performed when the networked system reaches
the threshold of mission reliability, for instance when MR(t) = MR 0 .
The solid curve represents the mission reliability curve, whereas the dashed line
is the threshold defined by requirements of networked systems operations, and the
dot-and-dash line indicates the ideal reliability state for a networked system. The
latest system states are measured and analyzed when the checking period arrives.
The confidence on the system grows and consequently the reliability curve if after
each online- checking no faults are detected (the system is free of faults) [3–5].
Maintenance should always be carried out when the reliability of the networked
system reaches the threshold, for that one can use existing network monitoring
schemes and tools. The rate of mission reliability degradation is directly linked to
the gain of recoverability implementation in networked systems. When there is lack
of preventive maintenance for long periods of time the reliability of networked
system reduces drastically to the lower threshold R 0 [3, 5, 14].
Fig. 18.7 Mission reliability for a CC system with incomplete coverage
264
18 Distributed Systems: Maximizing Resilience