

Let us leave an arithmetic exercise with various values of parameters from job
descriptions above to good master students.
Our estimation indicates that overheads of runtime system for distributed execution might achieve almost 60% of user task cost (time). We add in denominator
of (5) a coefficient k, a relative value of system software overheads per user task
(Eq. 17.9):
y ¼
1
ð1 À pÞ þ k þ
p
x
; x ¼ f1; 2; . . .; 10g; p ¼ f0:85g; k ¼ f0; 0:1; 0:4g ð17:9Þ
Following Eq. 17.9, the graph of Fig. 17.16 presents three curves in three colors:
green, blue, and red k = 0, 0.1, 04, respectively. The top one stands for known
“pure” Amdahl ratio (k = 0).
Figure 17.18 shows that for extremely good runtime system, one can double
performance with 4 cores. It is still too optimistic statement, especially recalling
Multics 85% and Window 65% of total workload time.
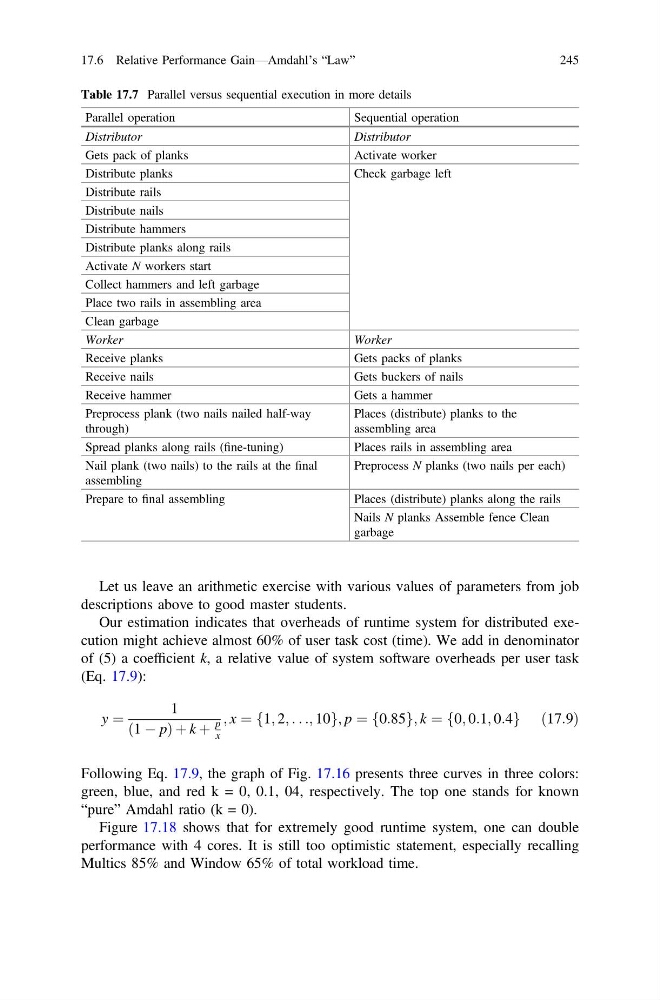
Table 17.7 Parallel versus sequential execution in more details
Parallel operation
Sequential operation
Distributor
Distributor
Gets pack of planks
Activate worker
Distribute planks
Check garbage left
Distribute rails
Distribute nails
Distribute hammers
Distribute planks along rails
Activate N workers start
Collect hammers and left garbage
Place two rails in assembling area
Clean garbage
Worker
Worker
Receive planks
Gets packs of planks
Receive nails
Gets buckers of nails
Receive hammer
Gets a hammer
Preprocess plank (two nails nailed half-way
through)
Places (distribute) planks to the
assembling area
Spread planks along rails (fine-tuning)
Places rails in assembling area
Nail plank (two nails) to the rails at the final
assembling
Preprocess N planks (two nails per each)
Prepare to final assembling
Places (distribute) planks along the rails
Nails N planks Assemble fence Clean
garbage
17.6 Relative Performance Gain—Amdahl’s “Law”
245
descriptions above to good master students.
Our estimation indicates that overheads of runtime system for distributed execution might achieve almost 60% of user task cost (time). We add in denominator
of (5) a coefficient k, a relative value of system software overheads per user task
(Eq. 17.9):
y ¼
1
ð1 À pÞ þ k þ
p
x
; x ¼ f1; 2; . . .; 10g; p ¼ f0:85g; k ¼ f0; 0:1; 0:4g ð17:9Þ
Following Eq. 17.9, the graph of Fig. 17.16 presents three curves in three colors:
green, blue, and red k = 0, 0.1, 04, respectively. The top one stands for known
“pure” Amdahl ratio (k = 0).
Figure 17.18 shows that for extremely good runtime system, one can double
performance with 4 cores. It is still too optimistic statement, especially recalling
Multics 85% and Window 65% of total workload time.
Table 17.7 Parallel versus sequential execution in more details
Parallel operation
Sequential operation
Distributor
Distributor
Gets pack of planks
Activate worker
Distribute planks
Check garbage left
Distribute rails
Distribute nails
Distribute hammers
Distribute planks along rails
Activate N workers start
Collect hammers and left garbage
Place two rails in assembling area
Clean garbage
Worker
Worker
Receive planks
Gets packs of planks
Receive nails
Gets buckers of nails
Receive hammer
Gets a hammer
Preprocess plank (two nails nailed half-way
through)
Places (distribute) planks to the
assembling area
Spread planks along rails (fine-tuning)
Places rails in assembling area
Nail plank (two nails) to the rails at the final
assembling
Preprocess N planks (two nails per each)
Prepare to final assembling
Places (distribute) planks along the rails
Nails N planks Assemble fence Clean
garbage
17.6 Relative Performance Gain—Amdahl’s “Law”
245