

18
2 Aggregation
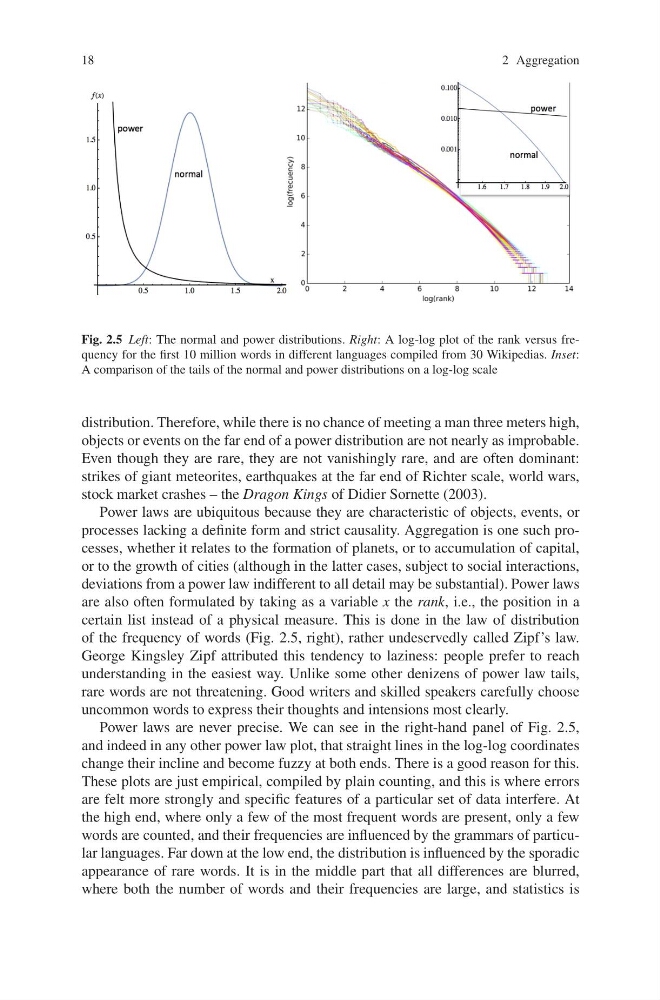
Fig. 2.5 Left: The normal and power distributions. Right: A log-log plot of the rank versus frequency for the first 10 million words in different languages compiled from 30 Wikipedias. Inset:
A comparison of the tails of the normal and power distributions on a log-log scale
distribution. Therefore, while there is no chance of meeting a man three meters high,
objects or events on the far end of a power distribution are not nearly as improbable.
Even though they are rare, they are not vanishingly rare, and are often dominant:
strikes of giant meteorites, earthquakes at the far end of Richter scale, world wars,
stock market crashes – the Dragon Kings of Didier Sornette (2003).
Power laws are ubiquitous because they are characteristic of objects, events, or
processes lacking a definite form and strict causality. Aggregation is one such processes, whether it relates to the formation of planets, or to accumulation of capital,
or to the growth of cities (although in the latter cases, subject to social interactions,
deviations from a power law indifferent to all detail may be substantial). Power laws
are also often formulated by taking as a variable x the rank, i.e., the position in a
certain list instead of a physical measure. This is done in the law of distribution
of the frequency of words (Fig. 2.5, right), rather undeservedly called Zipf’s law.
George Kingsley Zipf attributed this tendency to laziness: people prefer to reach
understanding in the easiest way. Unlike some other denizens of power law tails,
rare words are not threatening. Good writers and skilled speakers carefully choose
uncommon words to express their thoughts and intensions most clearly.
Power laws are never precise. We can see in the right-hand panel of Fig. 2.5,
and indeed in any other power law plot, that straight lines in the log-log coordinates
change their incline and become fuzzy at both ends. There is a good reason for this.
These plots are just empirical, compiled by plain counting, and this is where errors
are felt more strongly and specific features of a particular set of data interfere. At
the high end, where only a few of the most frequent words are present, only a few
words are counted, and their frequencies are influenced by the grammars of particular languages. Far down at the low end, the distribution is influenced by the sporadic
appearance of rare words. It is in the middle part that all differences are blurred,
where both the number of words and their frequencies are large, and statistics is
2 Aggregation
Fig. 2.5 Left: The normal and power distributions. Right: A log-log plot of the rank versus frequency for the first 10 million words in different languages compiled from 30 Wikipedias. Inset:
A comparison of the tails of the normal and power distributions on a log-log scale
distribution. Therefore, while there is no chance of meeting a man three meters high,
objects or events on the far end of a power distribution are not nearly as improbable.
Even though they are rare, they are not vanishingly rare, and are often dominant:
strikes of giant meteorites, earthquakes at the far end of Richter scale, world wars,
stock market crashes – the Dragon Kings of Didier Sornette (2003).
Power laws are ubiquitous because they are characteristic of objects, events, or
processes lacking a definite form and strict causality. Aggregation is one such processes, whether it relates to the formation of planets, or to accumulation of capital,
or to the growth of cities (although in the latter cases, subject to social interactions,
deviations from a power law indifferent to all detail may be substantial). Power laws
are also often formulated by taking as a variable x the rank, i.e., the position in a
certain list instead of a physical measure. This is done in the law of distribution
of the frequency of words (Fig. 2.5, right), rather undeservedly called Zipf’s law.
George Kingsley Zipf attributed this tendency to laziness: people prefer to reach
understanding in the easiest way. Unlike some other denizens of power law tails,
rare words are not threatening. Good writers and skilled speakers carefully choose
uncommon words to express their thoughts and intensions most clearly.
Power laws are never precise. We can see in the right-hand panel of Fig. 2.5,
and indeed in any other power law plot, that straight lines in the log-log coordinates
change their incline and become fuzzy at both ends. There is a good reason for this.
These plots are just empirical, compiled by plain counting, and this is where errors
are felt more strongly and specific features of a particular set of data interfere. At
the high end, where only a few of the most frequent words are present, only a few
words are counted, and their frequencies are influenced by the grammars of particular languages. Far down at the low end, the distribution is influenced by the sporadic
appearance of rare words. It is in the middle part that all differences are blurred,
where both the number of words and their frequencies are large, and statistics is