

6.3 Geometrically Nonlinear Analysis of Smart Structures
125
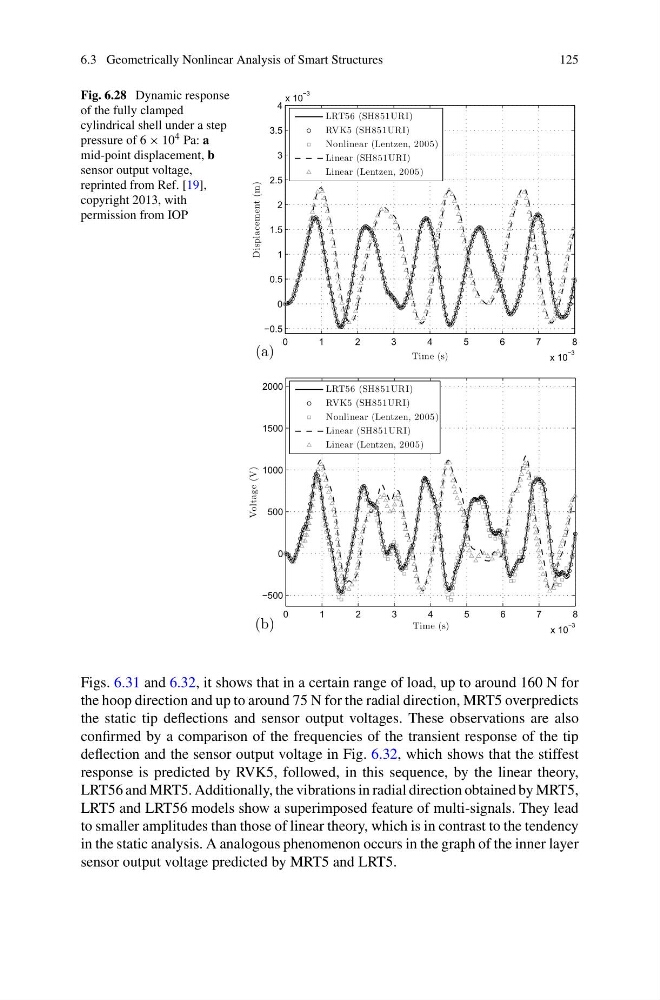
Fig. 6.28 Dynamic response
of the fully clamped
cylindrical shell under a step
pressure of 6 × 10 4 Pa: a
mid-point displacement, b
sensor output voltage,
reprinted from Ref. [19],
copyright 2013, with
permission from IOP
(a)
0
1
2
3
4
5
6
7
8
x 10
−3
−0.5
0
0.5
1
1.5
2
2.5
3
3.5
4
x 10
−3
Time (s)
Displacement (m)
LRT56 (SH851URI)
RVK5 (SH851URI)
Nonlinear (Lentzen, 2005)
Linear (SH851URI)
Linear (Lentzen, 2005)
(b)
0
1
2
3
4
5
6
7
8
x 10
−3
−500
0
500
1000
1500
2000
Time (s)
Voltage (V)
LRT56 (SH851URI)
RVK5 (SH851URI)
Nonlinear (Lentzen, 2005)
Linear (SH851URI)
Linear (Lentzen, 2005)
Figs. 6.31 and 6.32, it shows that in a certain range of load, up to around 160 N for
the hoop direction and up to around 75 N for the radial direction, MRT5 overpredicts
the static tip deflections and sensor output voltages. These observations are also
confirmed by a comparison of the frequencies of the transient response of the tip
deflection and the sensor output voltage in Fig. 6.32, which shows that the stiffest
response is predicted by RVK5, followed, in this sequence, by the linear theory,
LRT56 and MRT5. Additionally, the vibrations in radial direction obtained by MRT5,
LRT5 and LRT56 models show a superimposed feature of multi-signals. They lead
to smaller amplitudes than those of linear theory, which is in contrast to the tendency
in the static analysis. A analogous phenomenon occurs in the graph of the inner layer
sensor output voltage predicted by MRT5 and LRT5.
125
Fig. 6.28 Dynamic response
of the fully clamped
cylindrical shell under a step
pressure of 6 × 10 4 Pa: a
mid-point displacement, b
sensor output voltage,
reprinted from Ref. [19],
copyright 2013, with
permission from IOP
(a)
0
1
2
3
4
5
6
7
8
x 10
−3
−0.5
0
0.5
1
1.5
2
2.5
3
3.5
4
x 10
−3
Time (s)
Displacement (m)
LRT56 (SH851URI)
RVK5 (SH851URI)
Nonlinear (Lentzen, 2005)
Linear (SH851URI)
Linear (Lentzen, 2005)
(b)
0
1
2
3
4
5
6
7
8
x 10
−3
−500
0
500
1000
1500
2000
Time (s)
Voltage (V)
LRT56 (SH851URI)
RVK5 (SH851URI)
Nonlinear (Lentzen, 2005)
Linear (SH851URI)
Linear (Lentzen, 2005)
Figs. 6.31 and 6.32, it shows that in a certain range of load, up to around 160 N for
the hoop direction and up to around 75 N for the radial direction, MRT5 overpredicts
the static tip deflections and sensor output voltages. These observations are also
confirmed by a comparison of the frequencies of the transient response of the tip
deflection and the sensor output voltage in Fig. 6.32, which shows that the stiffest
response is predicted by RVK5, followed, in this sequence, by the linear theory,
LRT56 and MRT5. Additionally, the vibrations in radial direction obtained by MRT5,
LRT5 and LRT56 models show a superimposed feature of multi-signals. They lead
to smaller amplitudes than those of linear theory, which is in contrast to the tendency
in the static analysis. A analogous phenomenon occurs in the graph of the inner layer
sensor output voltage predicted by MRT5 and LRT5.