

(2) Figures 12.35, 12.36, 12.37 and 12.38 show the horizontal stress contour map,
the vertical stress contour map, the radial stress contour map and the comprehensive equivalent stress contour map in unit of MPa. From the stress
contour map, it can be seen that: As shown in Fig. 12.35, in the X direction of
the horizontal stress contour map, the large stress area is concentrated at the pile
bottom and around the pile body. The stress of the soil in the central area of the
pile bottom is the largest, 255:8 MPa. With the distance from the steel pipe
piles, the stress on the soil decreases and the distribution area enlarges gradually. As shown in Fig. 12.36, in the Y-direction of the vertical stress contour
map, the stress gradually decreases from the top of the pile to the bottom of the
pile and then to the contact soil, and the maximum stress is at the top of the pile,
reaching gigapa. As shown in Fig. 12.38, the total stress distribution is similar
to that in the Y-direction. The stress decreases gradually from the top of the pile
to the bottom of the pile and then to the contact soil, and the maximum stress is
at the top of the pile, reaching gigapa. It can be seen that the stress at the contact
point between the hammer and the pile is the greatest. Usually, the replacement
device is set between the hammer and the top of the pile when driving the pile.
(3) Figure 12.39 shows the shear stress contour map in unit of MPa. From the
shear stress contour diagram, it can be seen that: The maximum shear stress is
159:6 MPa on the outside of the pile. The soil around the pile gradually diffuses
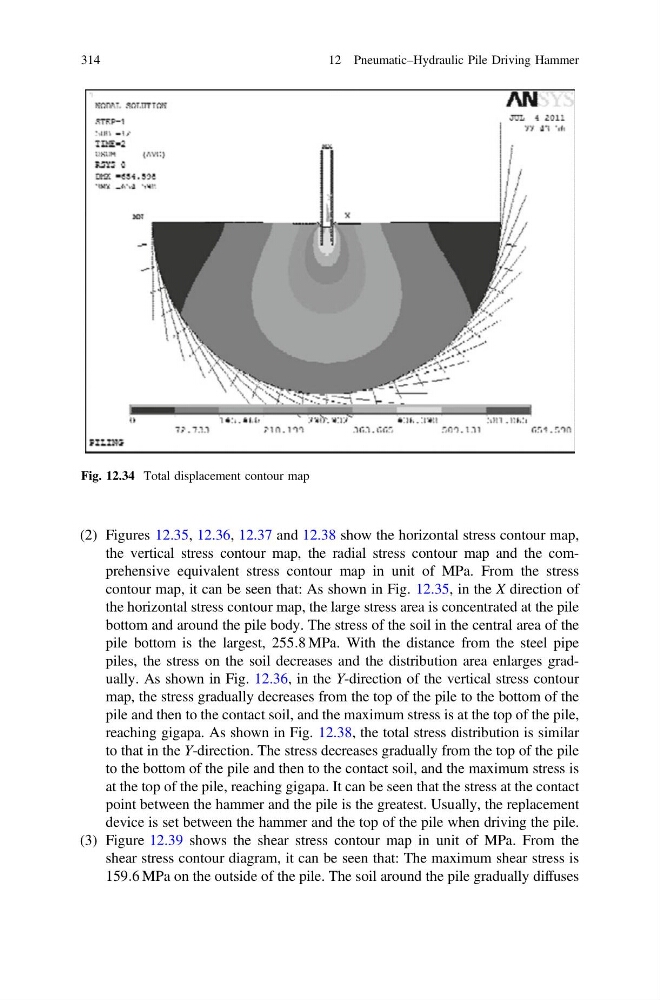
Fig. 12.34 Total displacement contour map
314
12 Pneumatic–Hydraulic Pile Driving Hammer
the vertical stress contour map, the radial stress contour map and the comprehensive equivalent stress contour map in unit of MPa. From the stress
contour map, it can be seen that: As shown in Fig. 12.35, in the X direction of
the horizontal stress contour map, the large stress area is concentrated at the pile
bottom and around the pile body. The stress of the soil in the central area of the
pile bottom is the largest, 255:8 MPa. With the distance from the steel pipe
piles, the stress on the soil decreases and the distribution area enlarges gradually. As shown in Fig. 12.36, in the Y-direction of the vertical stress contour
map, the stress gradually decreases from the top of the pile to the bottom of the
pile and then to the contact soil, and the maximum stress is at the top of the pile,
reaching gigapa. As shown in Fig. 12.38, the total stress distribution is similar
to that in the Y-direction. The stress decreases gradually from the top of the pile
to the bottom of the pile and then to the contact soil, and the maximum stress is
at the top of the pile, reaching gigapa. It can be seen that the stress at the contact
point between the hammer and the pile is the greatest. Usually, the replacement
device is set between the hammer and the top of the pile when driving the pile.
(3) Figure 12.39 shows the shear stress contour map in unit of MPa. From the
shear stress contour diagram, it can be seen that: The maximum shear stress is
159:6 MPa on the outside of the pile. The soil around the pile gradually diffuses
Fig. 12.34 Total displacement contour map
314
12 Pneumatic–Hydraulic Pile Driving Hammer