

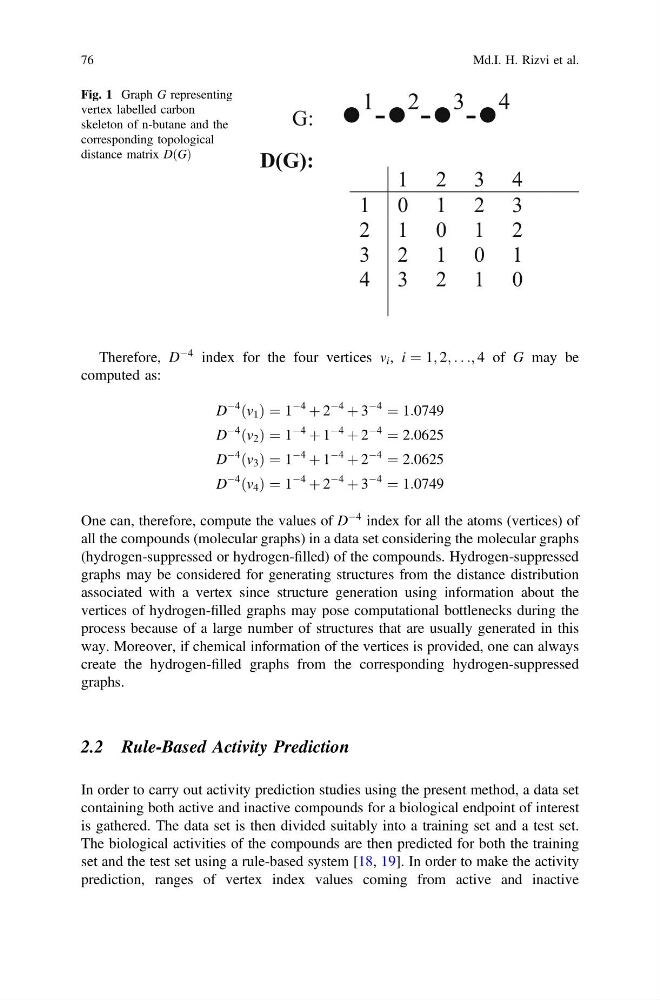
Therefore, D
À4 index for the four vertices v i , i ¼ 1; 2; . . .; 4 of G may be
computed as:
D
À4 v 1
ð Þ ¼ 1
À4
þ 2
À4
þ 3
À4
¼ 1:0749
D
À4 v 2
ð Þ ¼ 1
À4
þ 1
À4
þ 2
À4
¼ 2:0625
D
À4 v 3
ð Þ ¼ 1
À4
þ 1
À4
þ 2
À4
¼ 2:0625
D
À4 v 4
ð Þ ¼ 1
À4
þ 2
À4
þ 3
À4
¼ 1:0749
One can, therefore, compute the values of D
À4 index for all the atoms (vertices) of
all the compounds (molecular graphs) in a data set considering the molecular graphs
(hydrogen-suppressed or hydrogen-filled) of the compounds. Hydrogen-suppressed
graphs may be considered for generating structures from the distance distribution
associated with a vertex since structure generation using information about the
vertices of hydrogen-filled graphs may pose computational bottlenecks during the
process because of a large number of structures that are usually generated in this
way. Moreover, if chemical information of the vertices is provided, one can always
create the hydrogen-filled graphs from the corresponding hydrogen-suppressed
graphs.
2.2 Rule-Based Activity Prediction
In order to carry out activity prediction studies using the present method, a data set
containing both active and inactive compounds for a biological endpoint of interest
is gathered. The data set is then divided suitably into a training set and a test set.
The biological activities of the compounds are then predicted for both the training
set and the test set using a rule-based system [18, 19]. In order to make the activity
prediction, ranges of vertex index values coming from active and inactive
G: ●
1
-●
2
-●
3
-●
4
D(G):
1 2 3 4
1 0 1 2 3
2 1 0 1 2
3 2 1 0 1
4 3 2 1 0
Fig. 1 Graph G representing
vertex labelled carbon
skeleton of n-butane and the
corresponding topological
distance matrix D G
ð Þ
76
Md.I. H. Rizvi et al.
À4 index for the four vertices v i , i ¼ 1; 2; . . .; 4 of G may be
computed as:
D
À4 v 1
ð Þ ¼ 1
À4
þ 2
À4
þ 3
À4
¼ 1:0749
D
À4 v 2
ð Þ ¼ 1
À4
þ 1
À4
þ 2
À4
¼ 2:0625
D
À4 v 3
ð Þ ¼ 1
À4
þ 1
À4
þ 2
À4
¼ 2:0625
D
À4 v 4
ð Þ ¼ 1
À4
þ 2
À4
þ 3
À4
¼ 1:0749
One can, therefore, compute the values of D
À4 index for all the atoms (vertices) of
all the compounds (molecular graphs) in a data set considering the molecular graphs
(hydrogen-suppressed or hydrogen-filled) of the compounds. Hydrogen-suppressed
graphs may be considered for generating structures from the distance distribution
associated with a vertex since structure generation using information about the
vertices of hydrogen-filled graphs may pose computational bottlenecks during the
process because of a large number of structures that are usually generated in this
way. Moreover, if chemical information of the vertices is provided, one can always
create the hydrogen-filled graphs from the corresponding hydrogen-suppressed
graphs.
2.2 Rule-Based Activity Prediction
In order to carry out activity prediction studies using the present method, a data set
containing both active and inactive compounds for a biological endpoint of interest
is gathered. The data set is then divided suitably into a training set and a test set.
The biological activities of the compounds are then predicted for both the training
set and the test set using a rule-based system [18, 19]. In order to make the activity
prediction, ranges of vertex index values coming from active and inactive
G: ●
1
-●
2
-●
3
-●
4
D(G):
1 2 3 4
1 0 1 2 3
2 1 0 1 2
3 2 1 0 1
4 3 2 1 0
Fig. 1 Graph G representing
vertex labelled carbon
skeleton of n-butane and the
corresponding topological
distance matrix D G
ð Þ
76
Md.I. H. Rizvi et al.