

(a)
(d)
(e)
(c)
(b)
(f)
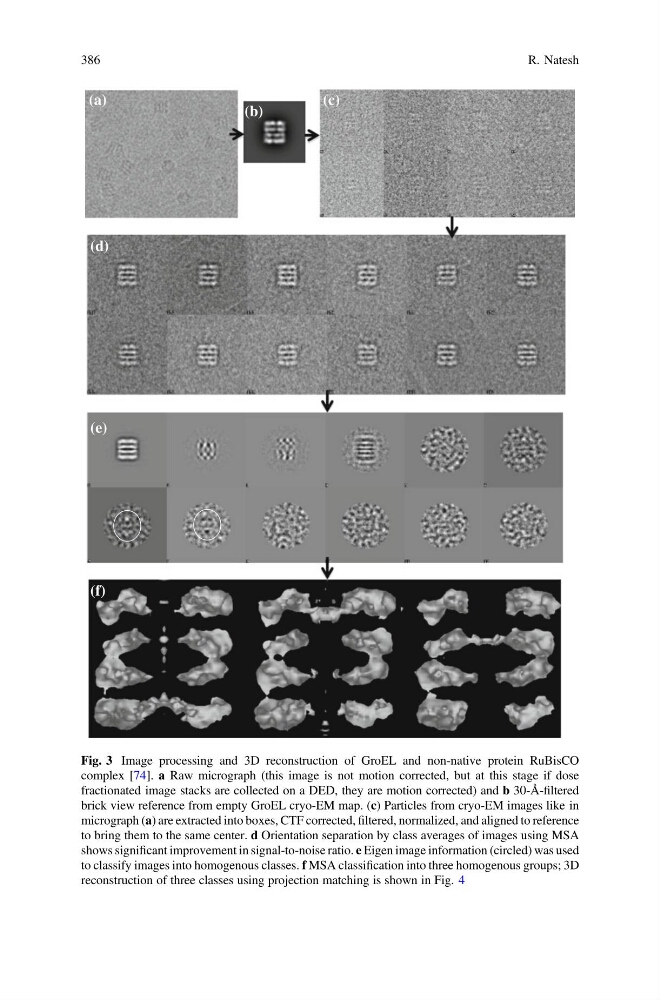
Fig. 3 Image processing and 3D reconstruction of GroEL and non-native protein RuBisCO
complex [74]. a Raw micrograph (this image is not motion corrected, but at this stage if dose
fractionated image stacks are collected on a DED, they are motion corrected) and b 30-Å-filtered
brick view reference from empty GroEL cryo-EM map. (c) Particles from cryo-EM images like in
micrograph (a) are extracted into boxes, CTF corrected, filtered, normalized, and aligned to reference
to bring them to the same center. d Orientation separation by class averages of images using MSA
shows significant improvement in signal-to-noise ratio. e Eigen image information (circled) was used
to classify images into homogenous classes. f MSA classification into three homogenous groups; 3D
reconstruction of three classes using projection matching is shown in Fig. 4
386
R. Natesh
(d)
(e)
(c)
(b)
(f)
Fig. 3 Image processing and 3D reconstruction of GroEL and non-native protein RuBisCO
complex [74]. a Raw micrograph (this image is not motion corrected, but at this stage if dose
fractionated image stacks are collected on a DED, they are motion corrected) and b 30-Å-filtered
brick view reference from empty GroEL cryo-EM map. (c) Particles from cryo-EM images like in
micrograph (a) are extracted into boxes, CTF corrected, filtered, normalized, and aligned to reference
to bring them to the same center. d Orientation separation by class averages of images using MSA
shows significant improvement in signal-to-noise ratio. e Eigen image information (circled) was used
to classify images into homogenous classes. f MSA classification into three homogenous groups; 3D
reconstruction of three classes using projection matching is shown in Fig. 4
386
R. Natesh