

architecture. Redundancy also occurs when the same set of calculations need to be
carried out for all the trajectories individually. This often becomes a bottleneck in
the research work, since recoding these programs to suit one’s purpose is quite
cumbersome. One often grapples around for an appropriate program/software, for
analyzing and visualizing the multiple MD simulations data. And in the absence of
a good program, one has to resort to writing codes and scripts. Also, loading
trajectory files for visualization and analysis using the present tools often becomes
extremely slow, since most of the codes are meant for serial processing and do not
support multiple processors. VMD [39] tries to solve this issue by means of
multi-threading, but the process becomes unresponsive when more than one trajectory is to be loaded at a time and visualized. The development of visualization
and analysis tool capable of analyzing terascale and petascale data along with
high-end visualization screens would accelerate the drug discovery process. Here,
an attempt has been made to develop a new visualization and analysis tool capable
of reading various file formats like AMBER [31], GROMACS [33] and doing most
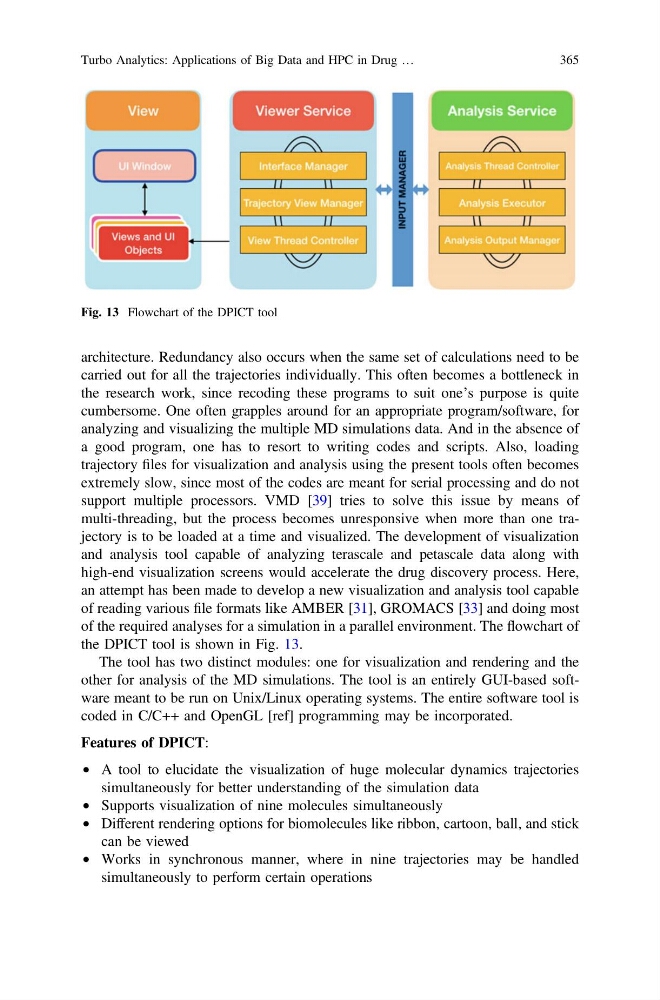
of the required analyses for a simulation in a parallel environment. The flowchart of
the DPICT tool is shown in Fig. 13.
The tool has two distinct modules: one for visualization and rendering and the
other for analysis of the MD simulations. The tool is an entirely GUI-based software meant to be run on Unix/Linux operating systems. The entire software tool is
coded in C/C++ and OpenGL [ref] programming may be incorporated.
Features of DPICT:
• A tool to elucidate the visualization of huge molecular dynamics trajectories
simultaneously for better understanding of the simulation data
• Supports visualization of nine molecules simultaneously
• Different rendering options for biomolecules like ribbon, cartoon, ball, and stick
can be viewed
• Works in synchronous manner, where in nine trajectories may be handled
simultaneously to perform certain operations
Fig. 13 Flowchart of the DPICT tool
Turbo Analytics: Applications of Big Data and HPC in Drug …
365
carried out for all the trajectories individually. This often becomes a bottleneck in
the research work, since recoding these programs to suit one’s purpose is quite
cumbersome. One often grapples around for an appropriate program/software, for
analyzing and visualizing the multiple MD simulations data. And in the absence of
a good program, one has to resort to writing codes and scripts. Also, loading
trajectory files for visualization and analysis using the present tools often becomes
extremely slow, since most of the codes are meant for serial processing and do not
support multiple processors. VMD [39] tries to solve this issue by means of
multi-threading, but the process becomes unresponsive when more than one trajectory is to be loaded at a time and visualized. The development of visualization
and analysis tool capable of analyzing terascale and petascale data along with
high-end visualization screens would accelerate the drug discovery process. Here,
an attempt has been made to develop a new visualization and analysis tool capable
of reading various file formats like AMBER [31], GROMACS [33] and doing most
of the required analyses for a simulation in a parallel environment. The flowchart of
the DPICT tool is shown in Fig. 13.
The tool has two distinct modules: one for visualization and rendering and the
other for analysis of the MD simulations. The tool is an entirely GUI-based software meant to be run on Unix/Linux operating systems. The entire software tool is
coded in C/C++ and OpenGL [ref] programming may be incorporated.
Features of DPICT:
• A tool to elucidate the visualization of huge molecular dynamics trajectories
simultaneously for better understanding of the simulation data
• Supports visualization of nine molecules simultaneously
• Different rendering options for biomolecules like ribbon, cartoon, ball, and stick
can be viewed
• Works in synchronous manner, where in nine trajectories may be handled
simultaneously to perform certain operations
Fig. 13 Flowchart of the DPICT tool
Turbo Analytics: Applications of Big Data and HPC in Drug …
365