

116
Alternative Fuels for Transportation
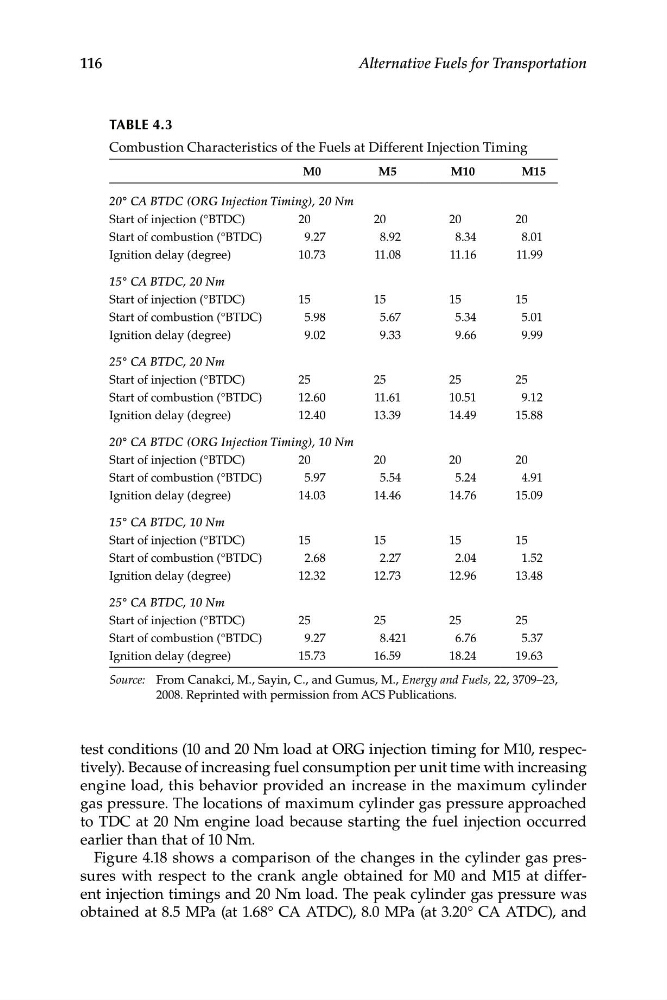
TABLe 4.3
Combustion Characteristics of the Fuels at Different Injection Timing
M0
M5
M10
M15
20° CA BTDC (ORG Injection Timing), 20 Nm
Start of injection (°BTDC)
20
20
20
20
Start of combustion (°BTDC)
9.27
8.92
8.34
8.01
Ignition delay (degree)
10.73
11.08
11.16
11.99
15° CA BTDC, 20 Nm
Start of injection (°BTDC)
15
15
15
15
Start of combustion (°BTDC)
5.98
5.67
5.34
5.01
Ignition delay (degree)
9.02
9.33
9.66
9.99
25° CA BTDC, 20 Nm
Start of injection (°BTDC)
25
25
25
25
Start of combustion (°BTDC)
12.60
11.61
10.51
9.12
Ignition delay (degree)
12.40
13.39
14.49
15.88
20° CA BTDC (ORG Injection Timing), 10 Nm
Start of injection (°BTDC)
20
20
20
20
Start of combustion (°BTDC)
5.97
5.54
5.24
4.91
Ignition delay (degree)
14.03
14.46
14.76
15.09
15° CA BTDC, 10 Nm
Start of injection (°BTDC)
15
15
15
15
Start of combustion (°BTDC)
2.68
2.27
2.04
1.52
Ignition delay (degree)
12.32
12.73
12.96
13.48
25° CA BTDC, 10 Nm
Start of injection (°BTDC)
25
25
25
25
Start of combustion (°BTDC)
9.27
8.421
6.76
5.37
Ignition delay (degree)
15.73
16.59
18.24
19.63
Source: From Canakci, M., Sayin, C., and Gumus, M., Energy and Fuels, 22, 3709–23,
2008. Reprinted with permission from ACS Publications.
test conditions (10 and 20 Nm load at ORG injection timing for M10, respectively). Because of increasing fuel consumption per unit time with increasing
engine load, this behavior provided an increase in the maximum cylinder
gas pressure. The locations of maximum cylinder gas pressure approached
to TDC at 20 Nm engine load because starting the fuel injection occurred
earlier than that of 10 Nm.
Figure 4.18 shows a comparison of the changes in the cylinder gas pressures with respect to the crank angle obtained for M0 and M15 at different injection timings and 20 Nm load. The peak cylinder gas pressure was
obtained at 8.5 MPa (at 1.68° CA ATDC), 8.0 MPa (at 3.20° CA ATDC), and
Alternative Fuels for Transportation
TABLe 4.3
Combustion Characteristics of the Fuels at Different Injection Timing
M0
M5
M10
M15
20° CA BTDC (ORG Injection Timing), 20 Nm
Start of injection (°BTDC)
20
20
20
20
Start of combustion (°BTDC)
9.27
8.92
8.34
8.01
Ignition delay (degree)
10.73
11.08
11.16
11.99
15° CA BTDC, 20 Nm
Start of injection (°BTDC)
15
15
15
15
Start of combustion (°BTDC)
5.98
5.67
5.34
5.01
Ignition delay (degree)
9.02
9.33
9.66
9.99
25° CA BTDC, 20 Nm
Start of injection (°BTDC)
25
25
25
25
Start of combustion (°BTDC)
12.60
11.61
10.51
9.12
Ignition delay (degree)
12.40
13.39
14.49
15.88
20° CA BTDC (ORG Injection Timing), 10 Nm
Start of injection (°BTDC)
20
20
20
20
Start of combustion (°BTDC)
5.97
5.54
5.24
4.91
Ignition delay (degree)
14.03
14.46
14.76
15.09
15° CA BTDC, 10 Nm
Start of injection (°BTDC)
15
15
15
15
Start of combustion (°BTDC)
2.68
2.27
2.04
1.52
Ignition delay (degree)
12.32
12.73
12.96
13.48
25° CA BTDC, 10 Nm
Start of injection (°BTDC)
25
25
25
25
Start of combustion (°BTDC)
9.27
8.421
6.76
5.37
Ignition delay (degree)
15.73
16.59
18.24
19.63
Source: From Canakci, M., Sayin, C., and Gumus, M., Energy and Fuels, 22, 3709–23,
2008. Reprinted with permission from ACS Publications.
test conditions (10 and 20 Nm load at ORG injection timing for M10, respectively). Because of increasing fuel consumption per unit time with increasing
engine load, this behavior provided an increase in the maximum cylinder
gas pressure. The locations of maximum cylinder gas pressure approached
to TDC at 20 Nm engine load because starting the fuel injection occurred
earlier than that of 10 Nm.
Figure 4.18 shows a comparison of the changes in the cylinder gas pressures with respect to the crank angle obtained for M0 and M15 at different injection timings and 20 Nm load. The peak cylinder gas pressure was
obtained at 8.5 MPa (at 1.68° CA ATDC), 8.0 MPa (at 3.20° CA ATDC), and