

310
D. Wang
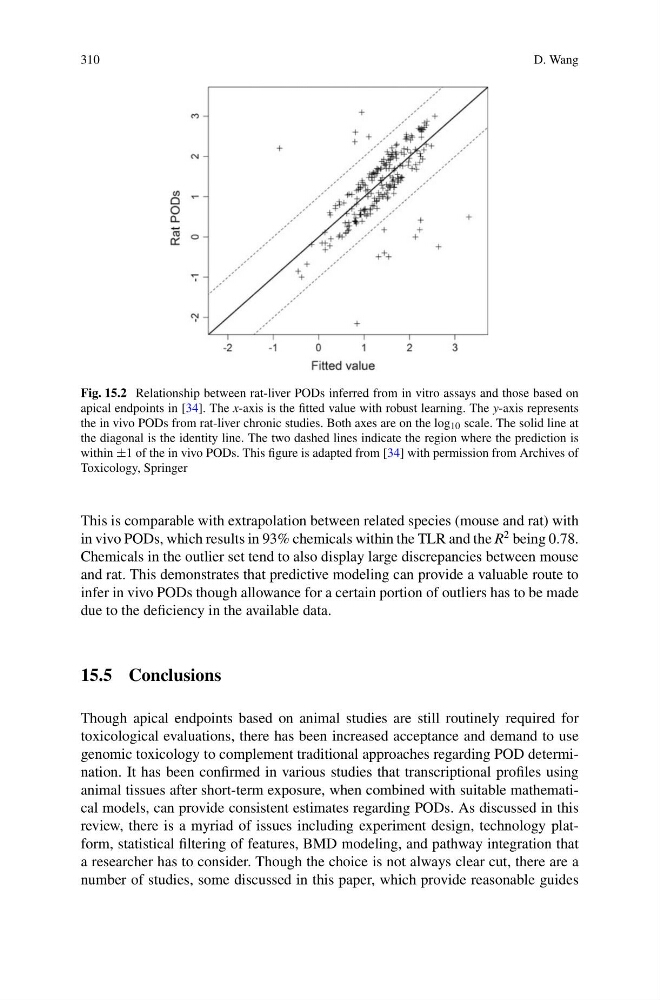
Fig. 15.2 Relationship between rat-liver PODs inferred from in vitro assays and those based on
apical endpoints in [34]. The x-axis is the fitted value with robust learning. The y-axis represents
the in vivo PODs from rat-liver chronic studies. Both axes are on the log 10 scale. The solid line at
the diagonal is the identity line. The two dashed lines indicate the region where the prediction is
within ±1 of the in vivo PODs. This figure is adapted from [34] with permission from Archives of
Toxicology, Springer
This is comparable with extrapolation between related species (mouse and rat) with
in vivo PODs, which results in 93% chemicals within the TLR and the R
2 being 0.78.
Chemicals in the outlier set tend to also display large discrepancies between mouse
and rat. This demonstrates that predictive modeling can provide a valuable route to
infer in vivo PODs though allowance for a certain portion of outliers has to be made
due to the deficiency in the available data.
15.5 Conclusions
Though apical endpoints based on animal studies are still routinely required for
toxicological evaluations, there has been increased acceptance and demand to use
genomic toxicology to complement traditional approaches regarding POD determination. It has been confirmed in various studies that transcriptional profiles using
animal tissues after short-term exposure, when combined with suitable mathematical models, can provide consistent estimates regarding PODs. As discussed in this
review, there is a myriad of issues including experiment design, technology platform, statistical filtering of features, BMD modeling, and pathway integration that
a researcher has to consider. Though the choice is not always clear cut, there are a
number of studies, some discussed in this paper, which provide reasonable guides
D. Wang
Fig. 15.2 Relationship between rat-liver PODs inferred from in vitro assays and those based on
apical endpoints in [34]. The x-axis is the fitted value with robust learning. The y-axis represents
the in vivo PODs from rat-liver chronic studies. Both axes are on the log 10 scale. The solid line at
the diagonal is the identity line. The two dashed lines indicate the region where the prediction is
within ±1 of the in vivo PODs. This figure is adapted from [34] with permission from Archives of
Toxicology, Springer
This is comparable with extrapolation between related species (mouse and rat) with
in vivo PODs, which results in 93% chemicals within the TLR and the R
2 being 0.78.
Chemicals in the outlier set tend to also display large discrepancies between mouse
and rat. This demonstrates that predictive modeling can provide a valuable route to
infer in vivo PODs though allowance for a certain portion of outliers has to be made
due to the deficiency in the available data.
15.5 Conclusions
Though apical endpoints based on animal studies are still routinely required for
toxicological evaluations, there has been increased acceptance and demand to use
genomic toxicology to complement traditional approaches regarding POD determination. It has been confirmed in various studies that transcriptional profiles using
animal tissues after short-term exposure, when combined with suitable mathematical models, can provide consistent estimates regarding PODs. As discussed in this
review, there is a myriad of issues including experiment design, technology platform, statistical filtering of features, BMD modeling, and pathway integration that
a researcher has to consider. Though the choice is not always clear cut, there are a
number of studies, some discussed in this paper, which provide reasonable guides