

304
D. Wang
Comparison to PODs derived from apical endpoints. As the focus of this review
is on genomic and high-throughput assays, POD analysis using apical endpoints will
not be discussed in detail. For more information, readers can refer to [17] and the
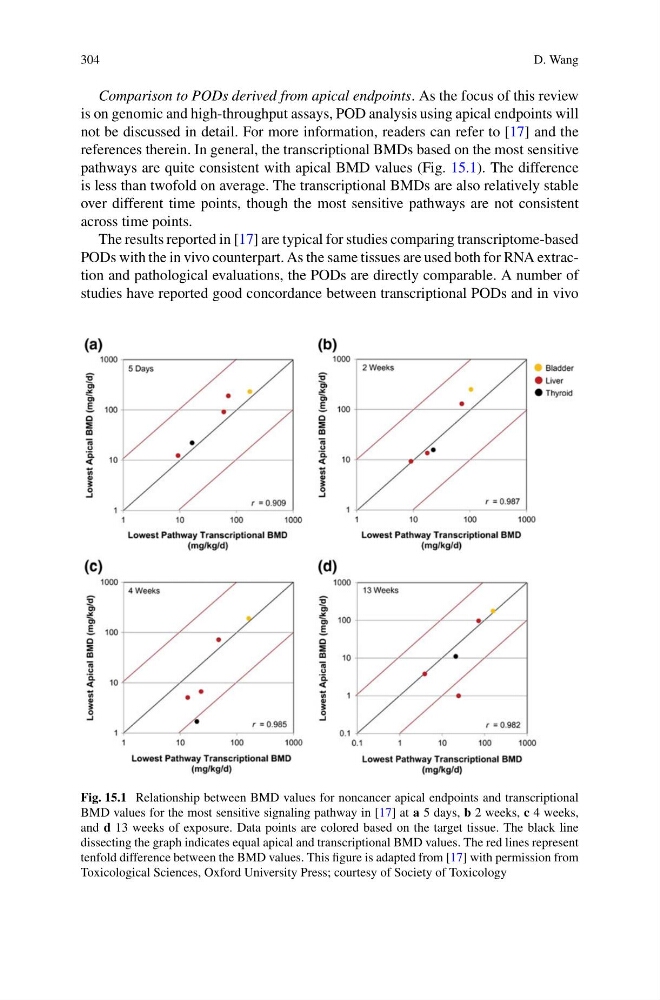
references therein. In general, the transcriptional BMDs based on the most sensitive
pathways are quite consistent with apical BMD values (Fig. 15.1). The difference
is less than twofold on average. The transcriptional BMDs are also relatively stable
over different time points, though the most sensitive pathways are not consistent
across time points.
The results reported in [17] are typical for studies comparing transcriptome-based
PODs with the in vivo counterpart. As the same tissues are used both for RNA extraction and pathological evaluations, the PODs are directly comparable. A number of
studies have reported good concordance between transcriptional PODs and in vivo
Fig. 15.1 Relationship between BMD values for noncancer apical endpoints and transcriptional
BMD values for the most sensitive signaling pathway in [17] at a 5 days, b 2 weeks, c 4 weeks,
and d 13 weeks of exposure. Data points are colored based on the target tissue. The black line
dissecting the graph indicates equal apical and transcriptional BMD values. The red lines represent
tenfold difference between the BMD values. This figure is adapted from [17] with permission from
Toxicological Sciences, Oxford University Press; courtesy of Society of Toxicology
D. Wang
Comparison to PODs derived from apical endpoints. As the focus of this review
is on genomic and high-throughput assays, POD analysis using apical endpoints will
not be discussed in detail. For more information, readers can refer to [17] and the
references therein. In general, the transcriptional BMDs based on the most sensitive
pathways are quite consistent with apical BMD values (Fig. 15.1). The difference
is less than twofold on average. The transcriptional BMDs are also relatively stable
over different time points, though the most sensitive pathways are not consistent
across time points.
The results reported in [17] are typical for studies comparing transcriptome-based
PODs with the in vivo counterpart. As the same tissues are used both for RNA extraction and pathological evaluations, the PODs are directly comparable. A number of
studies have reported good concordance between transcriptional PODs and in vivo
Fig. 15.1 Relationship between BMD values for noncancer apical endpoints and transcriptional
BMD values for the most sensitive signaling pathway in [17] at a 5 days, b 2 weeks, c 4 weeks,
and d 13 weeks of exposure. Data points are colored based on the target tissue. The black line
dissecting the graph indicates equal apical and transcriptional BMD values. The red lines represent
tenfold difference between the BMD values. This figure is adapted from [17] with permission from
Toxicological Sciences, Oxford University Press; courtesy of Society of Toxicology