

224
T. Hanser et al.
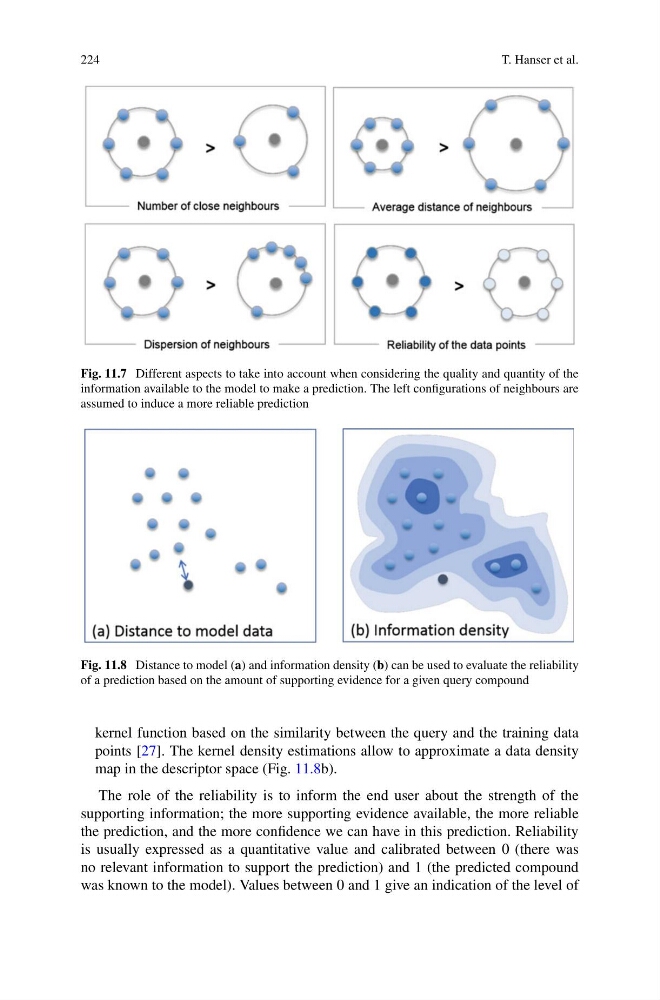
Fig. 11.7 Different aspects to take into account when considering the quality and quantity of the
information available to the model to make a prediction. The left configurations of neighbours are
assumed to induce a more reliable prediction
Fig. 11.8 Distance to model (a) and information density (b) can be used to evaluate the reliability
of a prediction based on the amount of supporting evidence for a given query compound
kernel function based on the similarity between the query and the training data
points [27]. The kernel density estimations allow to approximate a data density
map in the descriptor space (Fig. 11.8b).
The role of the reliability is to inform the end user about the strength of the
supporting information; the more supporting evidence available, the more reliable
the prediction, and the more confidence we can have in this prediction. Reliability
is usually expressed as a quantitative value and calibrated between 0 (there was
no relevant information to support the prediction) and 1 (the predicted compound
was known to the model). Values between 0 and 1 give an indication of the level of
T. Hanser et al.
Fig. 11.7 Different aspects to take into account when considering the quality and quantity of the
information available to the model to make a prediction. The left configurations of neighbours are
assumed to induce a more reliable prediction
Fig. 11.8 Distance to model (a) and information density (b) can be used to evaluate the reliability
of a prediction based on the amount of supporting evidence for a given query compound
kernel function based on the similarity between the query and the training data
points [27]. The kernel density estimations allow to approximate a data density
map in the descriptor space (Fig. 11.8b).
The role of the reliability is to inform the end user about the strength of the
supporting information; the more supporting evidence available, the more reliable
the prediction, and the more confidence we can have in this prediction. Reliability
is usually expressed as a quantitative value and calibrated between 0 (there was
no relevant information to support the prediction) and 1 (the predicted compound
was known to the model). Values between 0 and 1 give an indication of the level of