

8 An Overview of National Toxicology Program’s Toxicogenomic …
149
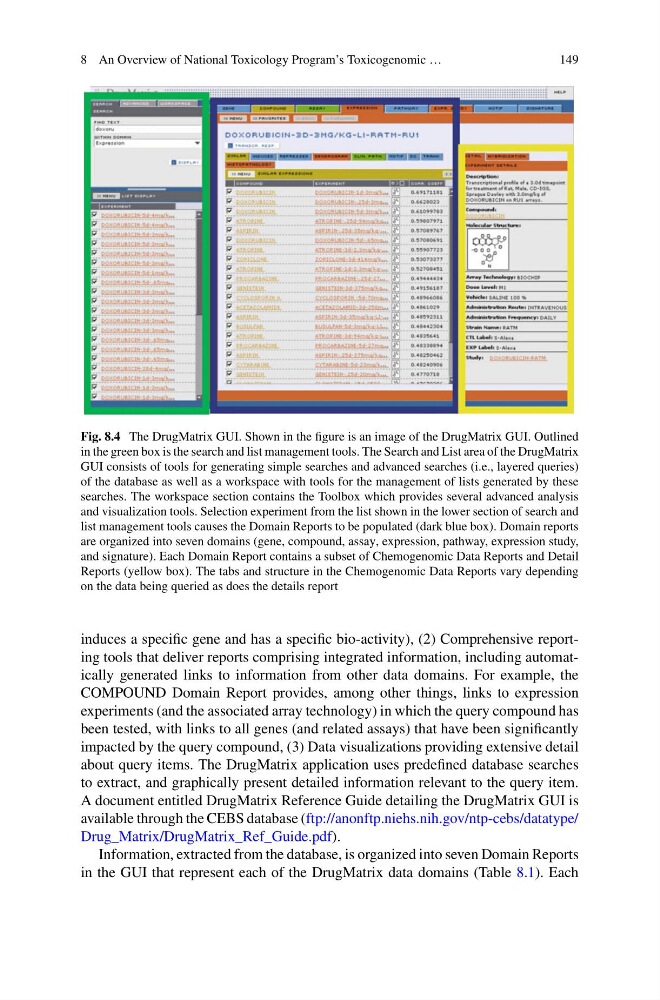
Fig. 8.4 The DrugMatrix GUI. Shown in the figure is an image of the DrugMatrix GUI. Outlined
in the green box is the search and list management tools. The Search and List area of the DrugMatrix
GUI consists of tools for generating simple searches and advanced searches (i.e., layered queries)
of the database as well as a workspace with tools for the management of lists generated by these
searches. The workspace section contains the Toolbox which provides several advanced analysis
and visualization tools. Selection experiment from the list shown in the lower section of search and
list management tools causes the Domain Reports to be populated (dark blue box). Domain reports
are organized into seven domains (gene, compound, assay, expression, pathway, expression study,
and signature). Each Domain Report contains a subset of Chemogenomic Data Reports and Detail
Reports (yellow box). The tabs and structure in the Chemogenomic Data Reports vary depending
on the data being queried as does the details report
induces a specific gene and has a specific bio-activity), (2) Comprehensive reporting tools that deliver reports comprising integrated information, including automatically generated links to information from other data domains. For example, the
COMPOUND Domain Report provides, among other things, links to expression
experiments (and the associated array technology) in which the query compound has
been tested, with links to all genes (and related assays) that have been significantly
impacted by the query compound, (3) Data visualizations providing extensive detail
about query items. The DrugMatrix application uses predefined database searches
to extract, and graphically present detailed information relevant to the query item.
A document entitled DrugMatrix Reference Guide detailing the DrugMatrix GUI is
available through the CEBS database (ftp://anonftp.niehs.nih.gov/ntp-cebs/datatype/
Drug_Matrix/DrugMatrix_Ref_Guide.pdf).
Information, extracted from the database, is organized into seven Domain Reports
in the GUI that represent each of the DrugMatrix data domains (Table 8.1). Each
149
Fig. 8.4 The DrugMatrix GUI. Shown in the figure is an image of the DrugMatrix GUI. Outlined
in the green box is the search and list management tools. The Search and List area of the DrugMatrix
GUI consists of tools for generating simple searches and advanced searches (i.e., layered queries)
of the database as well as a workspace with tools for the management of lists generated by these
searches. The workspace section contains the Toolbox which provides several advanced analysis
and visualization tools. Selection experiment from the list shown in the lower section of search and
list management tools causes the Domain Reports to be populated (dark blue box). Domain reports
are organized into seven domains (gene, compound, assay, expression, pathway, expression study,
and signature). Each Domain Report contains a subset of Chemogenomic Data Reports and Detail
Reports (yellow box). The tabs and structure in the Chemogenomic Data Reports vary depending
on the data being queried as does the details report
induces a specific gene and has a specific bio-activity), (2) Comprehensive reporting tools that deliver reports comprising integrated information, including automatically generated links to information from other data domains. For example, the
COMPOUND Domain Report provides, among other things, links to expression
experiments (and the associated array technology) in which the query compound has
been tested, with links to all genes (and related assays) that have been significantly
impacted by the query compound, (3) Data visualizations providing extensive detail
about query items. The DrugMatrix application uses predefined database searches
to extract, and graphically present detailed information relevant to the query item.
A document entitled DrugMatrix Reference Guide detailing the DrugMatrix GUI is
available through the CEBS database (ftp://anonftp.niehs.nih.gov/ntp-cebs/datatype/
Drug_Matrix/DrugMatrix_Ref_Guide.pdf).
Information, extracted from the database, is organized into seven Domain Reports
in the GUI that represent each of the DrugMatrix data domains (Table 8.1). Each