

202
S. Zhan et al.
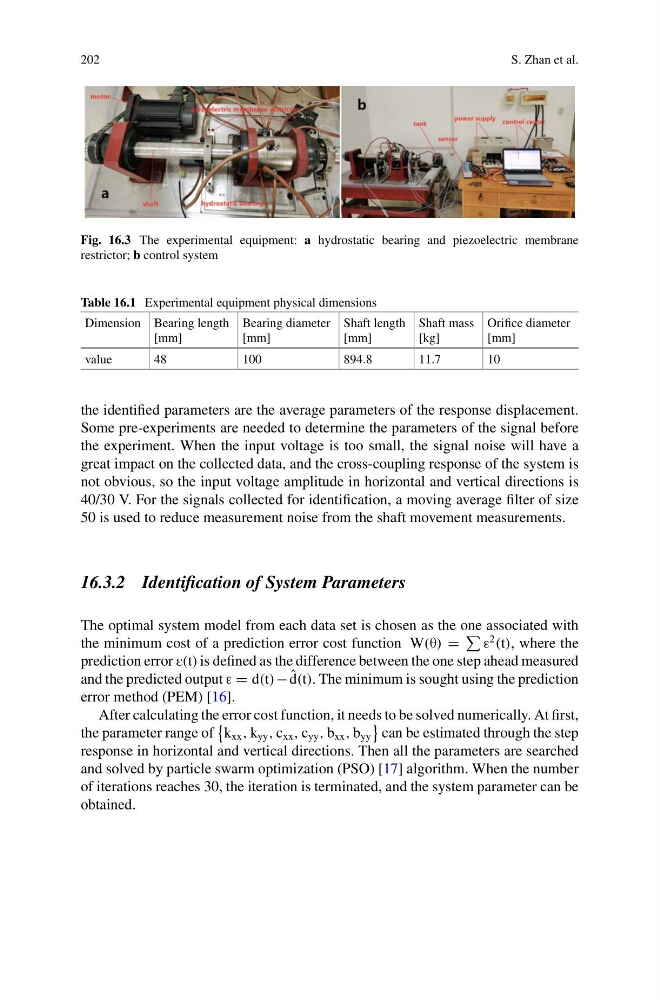
Fig. 16.3 The experimental equipment: a hydrostatic bearing and piezoelectric membrane
restrictor; b control system
Table 16.1 Experimental equipment physical dimensions
Dimension Bearing length
[mm]
Bearing diameter
[mm]
Shaft length
[mm]
Shaft mass
[kg]
Orifice diameter
[mm]
value
48
100
894.8
11.7
10
the identified parameters are the average parameters of the response displacement.
Some pre-experiments are needed to determine the parameters of the signal before
the experiment. When the input voltage is too small, the signal noise will have a
great impact on the collected data, and the cross-coupling response of the system is
not obvious, so the input voltage amplitude in horizontal and vertical directions is
40/30 V. For the signals collected for identification, a moving average filter of size
50 is used to reduce measurement noise from the shaft movement measurements.
16.3.2 Identification of System Parameters
The optimal system model from each data set is chosen as the one associated with
the minimum cost of a prediction error cost function W(θ) =
ε
2
(t), where the
prediction error E(t) is defined as the difference between the one step ahead measured
and the predicted output ε = d(t) − ˆ
d(t). The minimum is sought using the prediction
error method (PEM) [16].
After calculating the error cost function, it needs to be solved numerically. At first,
the parameter range of
k xx , k yy , c xx , c yy , b xx , b yy
can be estimated through the step
response in horizontal and vertical directions. Then all the parameters are searched
and solved by particle swarm optimization (PSO) [17] algorithm. When the number
of iterations reaches 30, the iteration is terminated, and the system parameter can be
obtained.
S. Zhan et al.
Fig. 16.3 The experimental equipment: a hydrostatic bearing and piezoelectric membrane
restrictor; b control system
Table 16.1 Experimental equipment physical dimensions
Dimension Bearing length
[mm]
Bearing diameter
[mm]
Shaft length
[mm]
Shaft mass
[kg]
Orifice diameter
[mm]
value
48
100
894.8
11.7
10
the identified parameters are the average parameters of the response displacement.
Some pre-experiments are needed to determine the parameters of the signal before
the experiment. When the input voltage is too small, the signal noise will have a
great impact on the collected data, and the cross-coupling response of the system is
not obvious, so the input voltage amplitude in horizontal and vertical directions is
40/30 V. For the signals collected for identification, a moving average filter of size
50 is used to reduce measurement noise from the shaft movement measurements.
16.3.2 Identification of System Parameters
The optimal system model from each data set is chosen as the one associated with
the minimum cost of a prediction error cost function W(θ) =
ε
2
(t), where the
prediction error E(t) is defined as the difference between the one step ahead measured
and the predicted output ε = d(t) − ˆ
d(t). The minimum is sought using the prediction
error method (PEM) [16].
After calculating the error cost function, it needs to be solved numerically. At first,
the parameter range of
k xx , k yy , c xx , c yy , b xx , b yy
can be estimated through the step
response in horizontal and vertical directions. Then all the parameters are searched
and solved by particle swarm optimization (PSO) [17] algorithm. When the number
of iterations reaches 30, the iteration is terminated, and the system parameter can be
obtained.