

14 PSD Random Vibration Strength and Fatigue Analysis …
175
represents a measure of the mean square value of random variables and is mostly used
for random vibration analysis. In many situations in reality, the load on the structure
and the corresponding time course are uncertain, so the method of transient analysis
is not applicable in the simulation calculation under this premise [11], continuous
transient response can only be described by a probability distribution function, i.e. the
probability corresponding to a certain level of response. The power spectral density
is the statistical result of the response of the structure under random dynamic load
excitation, and is a relationship curve between the power spectral density value and
the frequency value.
The traditional method is to repeat the design and experiment multiple times.
This method will lead to repeated design and excessive optimization, which is timeconsuming and inefficient [12]. In order to solve this problem regarding the shortcomings of traditional design methods, the products that have preliminarily designed are
analyzed using ANSYS simulation software which has been widely used in various
analyses including modal and random vibration analysis and then the weak parts of
the products are reinforced [13].
Random vibration analysis belongs to frequency domain analysis, and modal
analysis must be performed to obtain the natural frequency of the structure before
performing random vibration analysis.
14.3 Finite Element Modeling of Tube Trailer
For simplification but without affecting the results a lot, the flanges of the connection
between the gas cylinder and the baffle and the details of the individual support plates
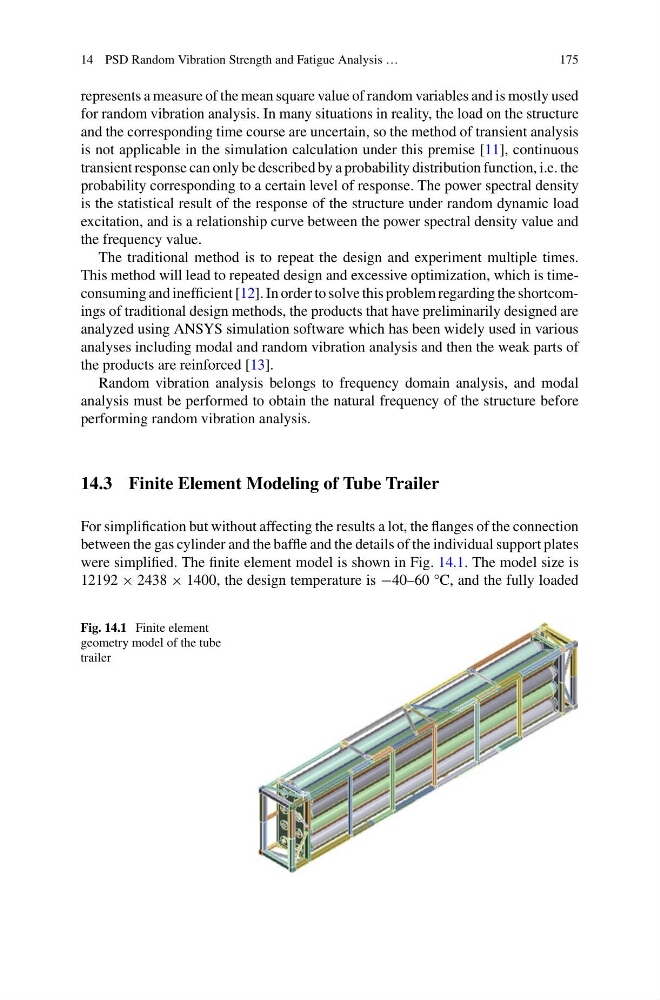
were simplified. The finite element model is shown in Fig. 14.1. The model size is
12192 × 2438 × 1400, the design temperature is −40–60 °C, and the fully loaded
Fig. 14.1 Finite element
geometry model of the tube
trailer
175
represents a measure of the mean square value of random variables and is mostly used
for random vibration analysis. In many situations in reality, the load on the structure
and the corresponding time course are uncertain, so the method of transient analysis
is not applicable in the simulation calculation under this premise [11], continuous
transient response can only be described by a probability distribution function, i.e. the
probability corresponding to a certain level of response. The power spectral density
is the statistical result of the response of the structure under random dynamic load
excitation, and is a relationship curve between the power spectral density value and
the frequency value.
The traditional method is to repeat the design and experiment multiple times.
This method will lead to repeated design and excessive optimization, which is timeconsuming and inefficient [12]. In order to solve this problem regarding the shortcomings of traditional design methods, the products that have preliminarily designed are
analyzed using ANSYS simulation software which has been widely used in various
analyses including modal and random vibration analysis and then the weak parts of
the products are reinforced [13].
Random vibration analysis belongs to frequency domain analysis, and modal
analysis must be performed to obtain the natural frequency of the structure before
performing random vibration analysis.
14.3 Finite Element Modeling of Tube Trailer
For simplification but without affecting the results a lot, the flanges of the connection
between the gas cylinder and the baffle and the details of the individual support plates
were simplified. The finite element model is shown in Fig. 14.1. The model size is
12192 × 2438 × 1400, the design temperature is −40–60 °C, and the fully loaded
Fig. 14.1 Finite element
geometry model of the tube
trailer