

obtaining the two gases from commercial sources. They also reported the
decomposition of commercial ammonia itself. The first group of (8) results
was reported at ‘900 °C’ with 10 mg iron (‘eisen’) as catalyst. The second
group of (6) results was reported at ‘800 °C’ with 1 g manganese as catalyst
and the third group of (6) results at ‘700 °C’ again 1 g with manganese as
catalyst.
‘Tabelle 1’, (Table 6.1) below—taken from ‘Bestimmung …’, shows
Robert’s published results at ‘900 °C’. Those presented at ‘700 °C’ and
‘800 °C’ employed a similar format.
Here the columns correspond to the EMF (voltage) across the
thermo-couple, the corresponding calibrated temperature (°C), the flow time
in minutes, the gas volume (in litres) used, that volume corrected to 0 °C and
760 mm (’standard’ ‘STP’ conditions at the time), the volume (cm
3 )
0.0523 N KOH solution used to neutralise the excess acid, the yield (in mg)
of ammonia at equilibrium and the % ammonia in the equilibrium mix. The
first two groups of rows correspond to the ‘development’ or formation of
ammonia using gases obtained from the decomposition of ammonia, and
from a mixture of (atmospheric) nitrogen and hydrogen respectively. The
third group row shows results from the decomposition of ammonia itself.
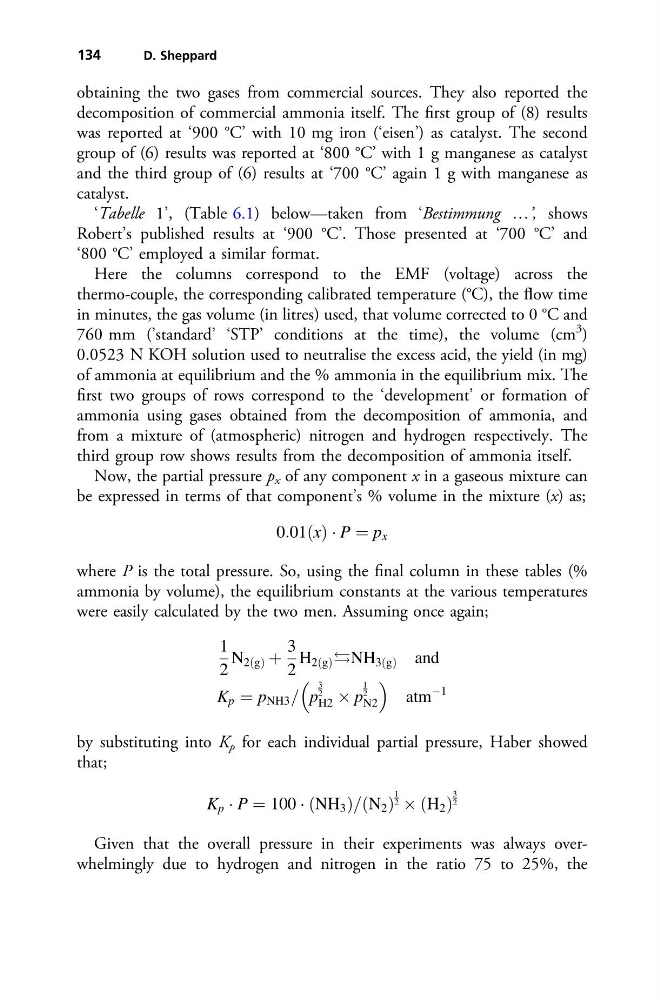
Now, the partial pressure p x of any component x in a gaseous mixture can
be expressed in terms of that component’s % volume in the mixture (x) as;
0:01ðxÞ Á P ¼ p x
where P is the total pressure. So, using the final column in these tables (%
ammonia by volume), the equilibrium constants at the various temperatures
were easily calculated by the two men. Assuming once again;
1
2
N 2ðgÞ þ
3
2
H 2ðgÞ NH 3ðgÞ and
K p ¼ p NH3 = p
3
2
H2 Â p
1
2
N2
atm
À1
by substituting into K p for each individual partial pressure, Haber showed
that;
K p Á P ¼ 100 Á ðNH 3 Þ=ðN 2 Þ
1
2 Â ðH 2 Þ
3
2
Given that the overall pressure in their experiments was always overwhelmingly due to hydrogen and nitrogen in the ratio 75 to 25%, the
134
D. Sheppard
decomposition of commercial ammonia itself. The first group of (8) results
was reported at ‘900 °C’ with 10 mg iron (‘eisen’) as catalyst. The second
group of (6) results was reported at ‘800 °C’ with 1 g manganese as catalyst
and the third group of (6) results at ‘700 °C’ again 1 g with manganese as
catalyst.
‘Tabelle 1’, (Table 6.1) below—taken from ‘Bestimmung …’, shows
Robert’s published results at ‘900 °C’. Those presented at ‘700 °C’ and
‘800 °C’ employed a similar format.
Here the columns correspond to the EMF (voltage) across the
thermo-couple, the corresponding calibrated temperature (°C), the flow time
in minutes, the gas volume (in litres) used, that volume corrected to 0 °C and
760 mm (’standard’ ‘STP’ conditions at the time), the volume (cm
3 )
0.0523 N KOH solution used to neutralise the excess acid, the yield (in mg)
of ammonia at equilibrium and the % ammonia in the equilibrium mix. The
first two groups of rows correspond to the ‘development’ or formation of
ammonia using gases obtained from the decomposition of ammonia, and
from a mixture of (atmospheric) nitrogen and hydrogen respectively. The
third group row shows results from the decomposition of ammonia itself.
Now, the partial pressure p x of any component x in a gaseous mixture can
be expressed in terms of that component’s % volume in the mixture (x) as;
0:01ðxÞ Á P ¼ p x
where P is the total pressure. So, using the final column in these tables (%
ammonia by volume), the equilibrium constants at the various temperatures
were easily calculated by the two men. Assuming once again;
1
2
N 2ðgÞ þ
3
2
H 2ðgÞ NH 3ðgÞ and
K p ¼ p NH3 = p
3
2
H2 Â p
1
2
N2
atm
À1
by substituting into K p for each individual partial pressure, Haber showed
that;
K p Á P ¼ 100 Á ðNH 3 Þ=ðN 2 Þ
1
2 Â ðH 2 Þ
3
2
Given that the overall pressure in their experiments was always overwhelmingly due to hydrogen and nitrogen in the ratio 75 to 25%, the
134
D. Sheppard