

6.1 Draining of a Tank
221
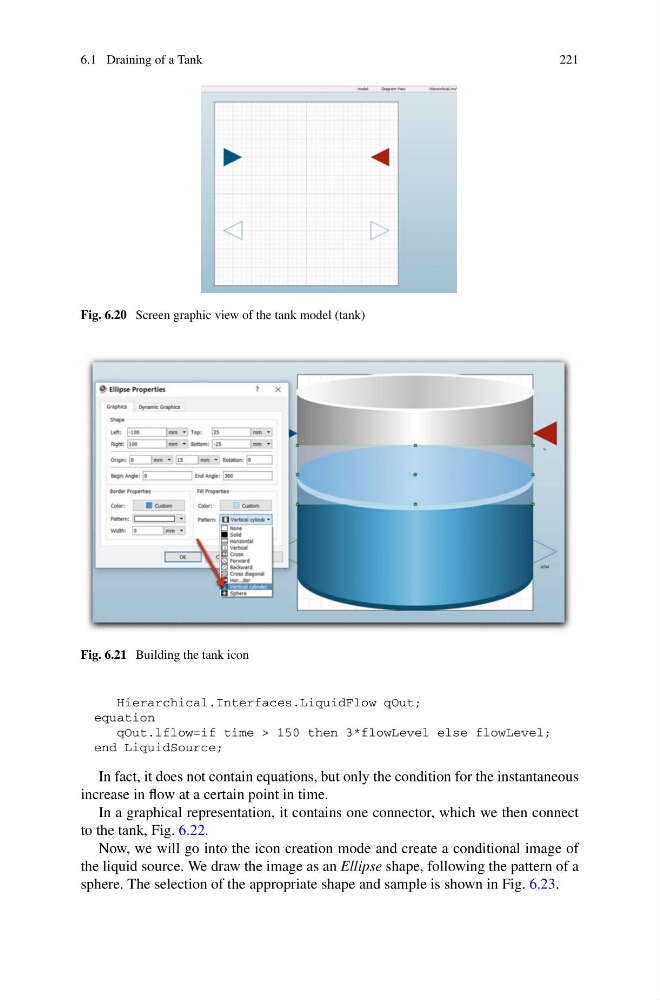
Fig. 6.20 Screen graphic view of the tank model (tank)
Fig. 6.21 Building the tank icon
Hierarchical.Interfaces.LiquidFlow qOut;
equation
qOut.lflow=if time > 150 then 3*flowLevel else flowLevel;
end LiquidSource;
In fact, it does not contain equations, but only the condition for the instantaneous
increase in flow at a certain point in time.
In a graphical representation, it contains one connector, which we then connect
to the tank, Fig. 6.22.
Now, we will go into the icon creation mode and create a conditional image of
the liquid source. We draw the image as an Ellipse shape, following the pattern of a
sphere. The selection of the appropriate shape and sample is shown in Fig. 6.23.
221
Fig. 6.20 Screen graphic view of the tank model (tank)
Fig. 6.21 Building the tank icon
Hierarchical.Interfaces.LiquidFlow qOut;
equation
qOut.lflow=if time > 150 then 3*flowLevel else flowLevel;
end LiquidSource;
In fact, it does not contain equations, but only the condition for the instantaneous
increase in flow at a certain point in time.
In a graphical representation, it contains one connector, which we then connect
to the tank, Fig. 6.22.
Now, we will go into the icon creation mode and create a conditional image of
the liquid source. We draw the image as an Ellipse shape, following the pattern of a
sphere. The selection of the appropriate shape and sample is shown in Fig. 6.23.