

5.9 Sophisticated Mechanical System with Springs and Block
205
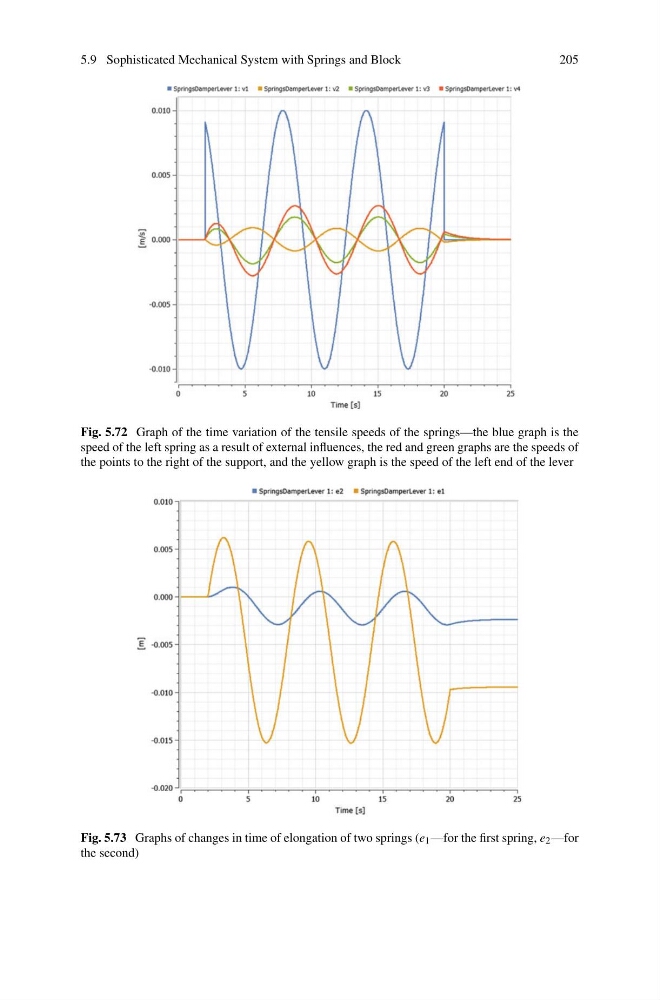
Fig. 5.72 Graph of the time variation of the tensile speeds of the springs—the blue graph is the
speed of the left spring as a result of external influences, the red and green graphs are the speeds of
the points to the right of the support, and the yellow graph is the speed of the left end of the lever
Fig. 5.73 Graphs of changes in time of elongation of two springs (e 1 —for the first spring, e 2 —for
the second)
205
Fig. 5.72 Graph of the time variation of the tensile speeds of the springs—the blue graph is the
speed of the left spring as a result of external influences, the red and green graphs are the speeds of
the points to the right of the support, and the yellow graph is the speed of the left end of the lever
Fig. 5.73 Graphs of changes in time of elongation of two springs (e 1 —for the first spring, e 2 —for
the second)