

Implementation and Performance Evaluation of Omni Compiler
91
5.4.3 Evaluation
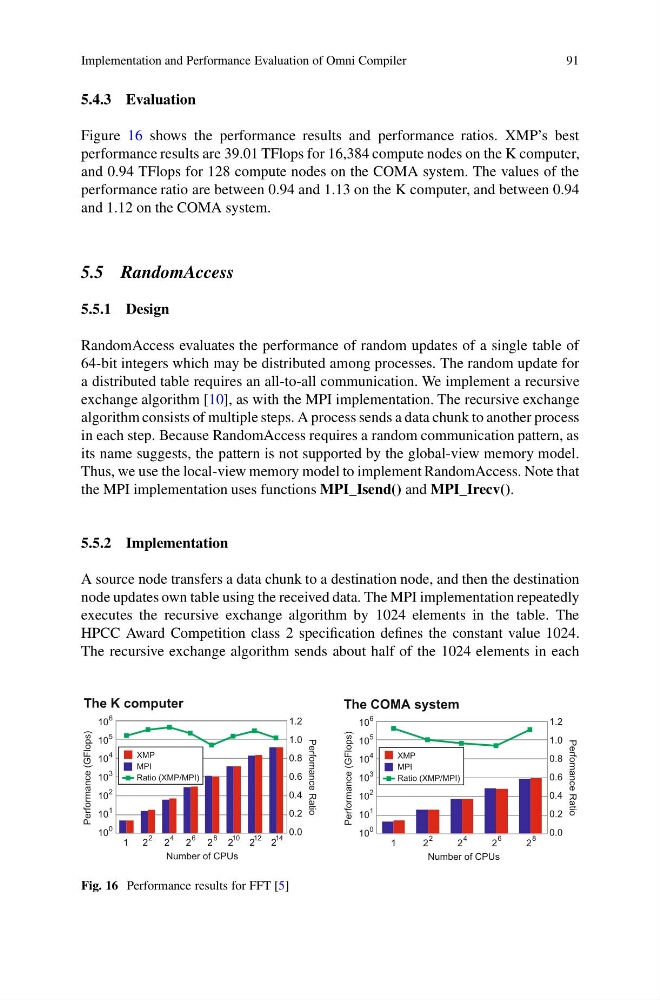
Figure 16 shows the performance results and performance ratios. XMP’s best
performance results are 39.01 TFlops for 16,384 compute nodes on the K computer,
and 0.94 TFlops for 128 compute nodes on the COMA system. The values of the
performance ratio are between 0.94 and 1.13 on the K computer, and between 0.94
and 1.12 on the COMA system.
5.5 RandomAccess
5.5.1 Design
RandomAccess evaluates the performance of random updates of a single table of
64-bit integers which may be distributed among processes. The random update for
a distributed table requires an all-to-all communication. We implement a recursive
exchange algorithm [10], as with the MPI implementation. The recursive exchange
algorithm consists of multiple steps. A process sends a data chunk to another process
in each step. Because RandomAccess requires a random communication pattern, as
its name suggests, the pattern is not supported by the global-view memory model.
Thus, we use the local-view memory model to implement RandomAccess. Note that
the MPI implementation uses functions MPI_Isend() and MPI_Irecv().
5.5.2 Implementation
A source node transfers a data chunk to a destination node, and then the destination
node updates own table using the received data. The MPI implementation repeatedly
executes the recursive exchange algorithm by 1024 elements in the table. The
HPCC Award Competition class 2 specification defines the constant value 1024.
The recursive exchange algorithm sends about half of the 1024 elements in each
10
10
10
10
10
10
10
6
5
4
3
2
1
0
Performance (GFlops)
1.2
1.0
0.8
0.6
0.4
0.2
0.0
Perfomance Ratio
Number of CPUs
1
2
4
2
2
2
6
2
10
2
8
2
12 2
14
XMP
MPI
Ratio (XMP/MPI)
10
10
10
10
10
10
10
6
5
4
3
2
1
0
Performance (GFlops)
1.2
1.0
0.8
0.6
0.4
0.2
0.0
Perfomance Ratio
Number of CPUs
1
2
4
2
2
2
6
2
8
XMP
MPI
Ratio (XMP/MPI)
The K computer
The COMA system
Fig. 16 Performance results for FFT [5]
91
5.4.3 Evaluation
Figure 16 shows the performance results and performance ratios. XMP’s best
performance results are 39.01 TFlops for 16,384 compute nodes on the K computer,
and 0.94 TFlops for 128 compute nodes on the COMA system. The values of the
performance ratio are between 0.94 and 1.13 on the K computer, and between 0.94
and 1.12 on the COMA system.
5.5 RandomAccess
5.5.1 Design
RandomAccess evaluates the performance of random updates of a single table of
64-bit integers which may be distributed among processes. The random update for
a distributed table requires an all-to-all communication. We implement a recursive
exchange algorithm [10], as with the MPI implementation. The recursive exchange
algorithm consists of multiple steps. A process sends a data chunk to another process
in each step. Because RandomAccess requires a random communication pattern, as
its name suggests, the pattern is not supported by the global-view memory model.
Thus, we use the local-view memory model to implement RandomAccess. Note that
the MPI implementation uses functions MPI_Isend() and MPI_Irecv().
5.5.2 Implementation
A source node transfers a data chunk to a destination node, and then the destination
node updates own table using the received data. The MPI implementation repeatedly
executes the recursive exchange algorithm by 1024 elements in the table. The
HPCC Award Competition class 2 specification defines the constant value 1024.
The recursive exchange algorithm sends about half of the 1024 elements in each
10
10
10
10
10
10
10
6
5
4
3
2
1
0
Performance (GFlops)
1.2
1.0
0.8
0.6
0.4
0.2
0.0
Perfomance Ratio
Number of CPUs
1
2
4
2
2
2
6
2
10
2
8
2
12 2
14
XMP
MPI
Ratio (XMP/MPI)
10
10
10
10
10
10
10
6
5
4
3
2
1
0
Performance (GFlops)
1.2
1.0
0.8
0.6
0.4
0.2
0.0
Perfomance Ratio
Number of CPUs
1
2
4
2
2
2
6
2
8
XMP
MPI
Ratio (XMP/MPI)
The K computer
The COMA system
Fig. 16 Performance results for FFT [5]