

208
A. Kubota et al.
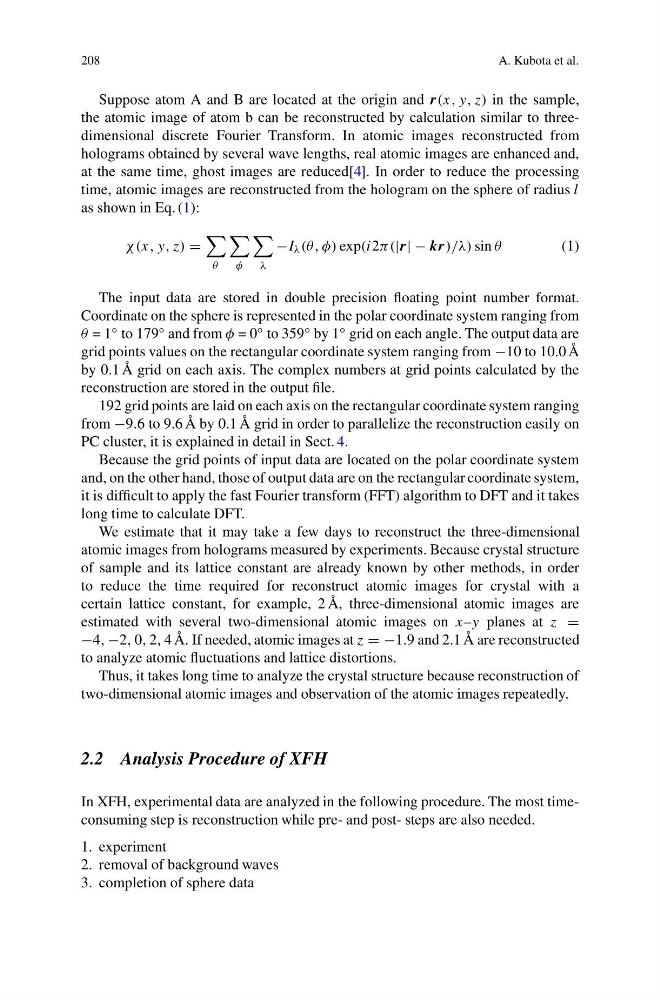
Suppose atom A and B are located at the origin and r(x, y, z) in the sample,
the atomic image of atom b can be reconstructed by calculation similar to threedimensional discrete Fourier Transform. In atomic images reconstructed from
holograms obtained by several wave lengths, real atomic images are enhanced and,
at the same time, ghost images are reduced[4]. In order to reduce the processing
time, atomic images are reconstructed from the hologram on the sphere of radius l
as shown in Eq. (1):
χ(x, y, z) =
θ
φ
λ
−I λ (θ, φ) exp(i2π(|r| − kr)/λ) sin θ
(1)
The input data are stored in double precision floating point number format.
Coordinate on the sphere is represented in the polar coordinate system ranging from
θ = 1 ◦ to 179 ◦ and from φ = 0 ◦ to 359 ◦ by 1 ◦ grid on each angle. The output data are
grid points values on the rectangular coordinate system ranging from −10 to 10.0 Å
by 0.1 Å grid on each axis. The complex numbers at grid points calculated by the
reconstruction are stored in the output file.
192 grid points are laid on each axis on the rectangular coordinate system ranging
from −9.6 to 9.6 Å by 0.1 Å grid in order to parallelize the reconstruction easily on
PC cluster, it is explained in detail in Sect. 4.
Because the grid points of input data are located on the polar coordinate system
and, on the other hand, those of output data are on the rectangular coordinate system,
it is difficult to apply the fast Fourier transform (FFT) algorithm to DFT and it takes
long time to calculate DFT.
We estimate that it may take a few days to reconstruct the three-dimensional
atomic images from holograms measured by experiments. Because crystal structure
of sample and its lattice constant are already known by other methods, in order
to reduce the time required for reconstruct atomic images for crystal with a
certain lattice constant, for example, 2 Å, three-dimensional atomic images are
estimated with several two-dimensional atomic images on x–y planes at z =
−4, −2, 0, 2, 4 Å. If needed, atomic images at z = −1.9 and 2.1 Å are reconstructed
to analyze atomic fluctuations and lattice distortions.
Thus, it takes long time to analyze the crystal structure because reconstruction of
two-dimensional atomic images and observation of the atomic images repeatedly.
2.2 Analysis Procedure of XFH
In XFH, experimental data are analyzed in the following procedure. The most timeconsuming step is reconstruction while pre- and post- steps are also needed.
1. experiment
2. removal of background waves
3. completion of sphere data
A. Kubota et al.
Suppose atom A and B are located at the origin and r(x, y, z) in the sample,
the atomic image of atom b can be reconstructed by calculation similar to threedimensional discrete Fourier Transform. In atomic images reconstructed from
holograms obtained by several wave lengths, real atomic images are enhanced and,
at the same time, ghost images are reduced[4]. In order to reduce the processing
time, atomic images are reconstructed from the hologram on the sphere of radius l
as shown in Eq. (1):
χ(x, y, z) =
θ
φ
λ
−I λ (θ, φ) exp(i2π(|r| − kr)/λ) sin θ
(1)
The input data are stored in double precision floating point number format.
Coordinate on the sphere is represented in the polar coordinate system ranging from
θ = 1 ◦ to 179 ◦ and from φ = 0 ◦ to 359 ◦ by 1 ◦ grid on each angle. The output data are
grid points values on the rectangular coordinate system ranging from −10 to 10.0 Å
by 0.1 Å grid on each axis. The complex numbers at grid points calculated by the
reconstruction are stored in the output file.
192 grid points are laid on each axis on the rectangular coordinate system ranging
from −9.6 to 9.6 Å by 0.1 Å grid in order to parallelize the reconstruction easily on
PC cluster, it is explained in detail in Sect. 4.
Because the grid points of input data are located on the polar coordinate system
and, on the other hand, those of output data are on the rectangular coordinate system,
it is difficult to apply the fast Fourier transform (FFT) algorithm to DFT and it takes
long time to calculate DFT.
We estimate that it may take a few days to reconstruct the three-dimensional
atomic images from holograms measured by experiments. Because crystal structure
of sample and its lattice constant are already known by other methods, in order
to reduce the time required for reconstruct atomic images for crystal with a
certain lattice constant, for example, 2 Å, three-dimensional atomic images are
estimated with several two-dimensional atomic images on x–y planes at z =
−4, −2, 0, 2, 4 Å. If needed, atomic images at z = −1.9 and 2.1 Å are reconstructed
to analyze atomic fluctuations and lattice distortions.
Thus, it takes long time to analyze the crystal structure because reconstruction of
two-dimensional atomic images and observation of the atomic images repeatedly.
2.2 Analysis Procedure of XFH
In XFH, experimental data are analyzed in the following procedure. The most timeconsuming step is reconstruction while pre- and post- steps are also needed.
1. experiment
2. removal of background waves
3. completion of sphere data