

1. Go to http://bar.utoronto.ca/cell_efp/cgi-bin/cell_efp.cgi.
2. Enter the AGI ID for a gene of interest, for example,
At3g24650. Click “Lookup.”
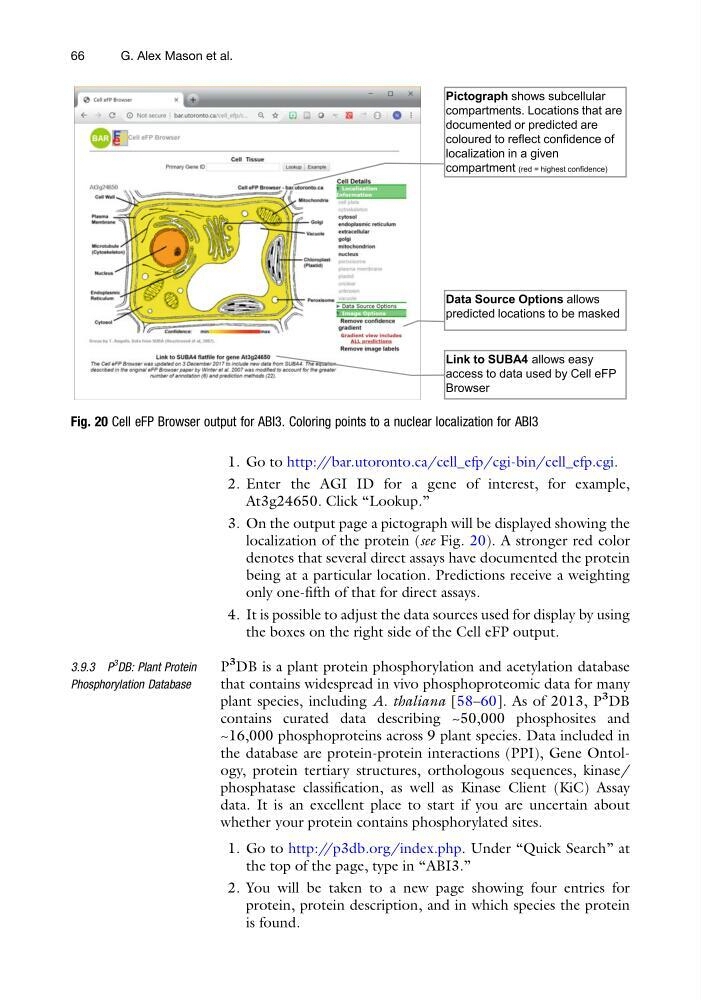
3. On the output page a pictograph will be displayed showing the
localization of the protein (see Fig. 20). A stronger red color
denotes that several direct assays have documented the protein
being at a particular location. Predictions receive a weighting
only one-fifth of that for direct assays.
4. It is possible to adjust the data sources used for display by using
the boxes on the right side of the Cell eFP output.
3.9.3 P
3 DB: Plant Protein
Phosphorylation Database
P
3 DB is a plant protein phosphorylation and acetylation database
that contains widespread in vivo phosphoproteomic data for many
plant species, including A. thaliana [58–60]. As of 2013, P
3
DB
contains curated data describing ~50,000 phosphosites and
~16,000 phosphoproteins across 9 plant species. Data included in
the database are protein-protein interactions (PPI), Gene Ontology, protein tertiary structures, orthologous sequences, kinase/
phosphatase classification, as well as Kinase Client (KiC) Assay
data. It is an excellent place to start if you are uncertain about
whether your protein contains phosphorylated sites.
1. Go to http://p3db.org/index.php. Under “Quick Search” at
the top of the page, type in “ABI3.”
2. You will be taken to a new page showing four entries for
protein, protein description, and in which species the protein
is found.
Fig. 20 Cell eFP Browser output for ABI3. Coloring points to a nuclear localization for ABI3
66
G. Alex Mason et al.
2. Enter the AGI ID for a gene of interest, for example,
At3g24650. Click “Lookup.”
3. On the output page a pictograph will be displayed showing the
localization of the protein (see Fig. 20). A stronger red color
denotes that several direct assays have documented the protein
being at a particular location. Predictions receive a weighting
only one-fifth of that for direct assays.
4. It is possible to adjust the data sources used for display by using
the boxes on the right side of the Cell eFP output.
3.9.3 P
3 DB: Plant Protein
Phosphorylation Database
P
3 DB is a plant protein phosphorylation and acetylation database
that contains widespread in vivo phosphoproteomic data for many
plant species, including A. thaliana [58–60]. As of 2013, P
3
DB
contains curated data describing ~50,000 phosphosites and
~16,000 phosphoproteins across 9 plant species. Data included in
the database are protein-protein interactions (PPI), Gene Ontology, protein tertiary structures, orthologous sequences, kinase/
phosphatase classification, as well as Kinase Client (KiC) Assay
data. It is an excellent place to start if you are uncertain about
whether your protein contains phosphorylated sites.
1. Go to http://p3db.org/index.php. Under “Quick Search” at
the top of the page, type in “ABI3.”
2. You will be taken to a new page showing four entries for
protein, protein description, and in which species the protein
is found.
Fig. 20 Cell eFP Browser output for ABI3. Coloring points to a nuclear localization for ABI3
66
G. Alex Mason et al.