

locus name (e.g., At3g24650) and the second the expression
value (see Note 22). Click on “Browse” to upload the file.
Choose “Relative” or “Absolute” values to display. We have
only one column of relative expression data. As our data are
log 2 -transformed, we will use the “0-centred scale.” We are
using locus names in our data, so choose “Gene names and/or
identifiers” as the items that appear in the first column of our
data file. In our data file we only have one experiment, so type
“1” in the Data columns to use box (if your data has multiple set
of values, type the numbers of the columns you want to display). We can also play with color scheme options and display
type. We will leave the other options as their defaults. Click
“Submit.”
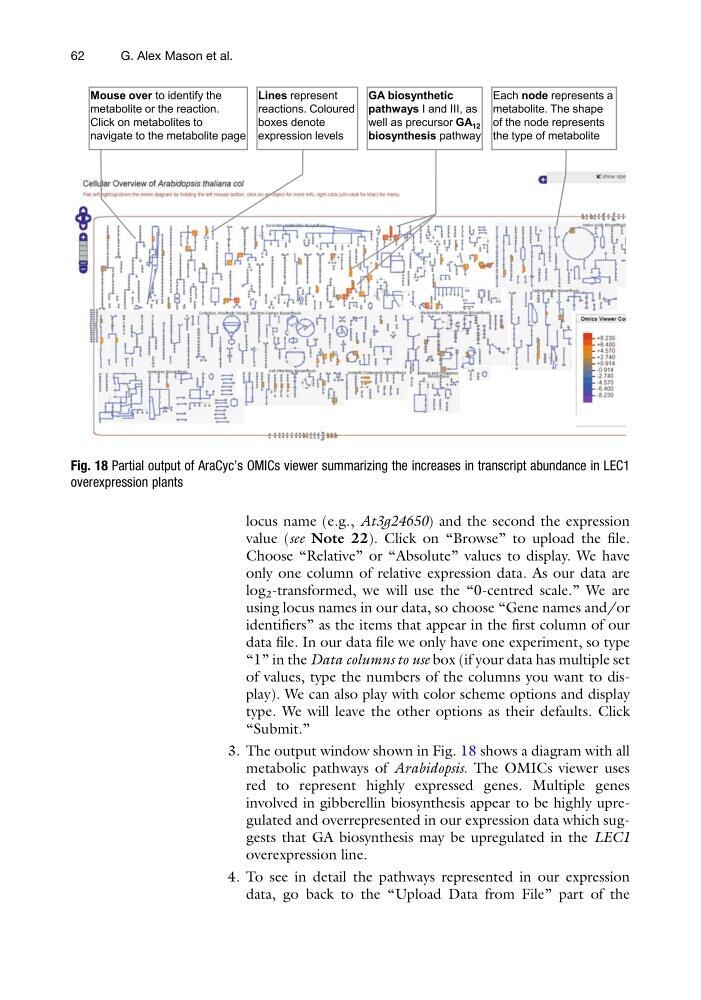
3. The output window shown in Fig. 18 shows a diagram with all
metabolic pathways of Arabidopsis. The OMICs viewer uses
red to represent highly expressed genes. Multiple genes
involved in gibberellin biosynthesis appear to be highly upregulated and overrepresented in our expression data which suggests that GA biosynthesis may be upregulated in the LEC1
overexpression line.
4. To see in detail the pathways represented in our expression
data, go back to the “Upload Data from File” part of the
Fig. 18 Partial output of AraCyc’s OMICs viewer summarizing the increases in transcript abundance in LEC1
overexpression plants
62
G. Alex Mason et al.
value (see Note 22). Click on “Browse” to upload the file.
Choose “Relative” or “Absolute” values to display. We have
only one column of relative expression data. As our data are
log 2 -transformed, we will use the “0-centred scale.” We are
using locus names in our data, so choose “Gene names and/or
identifiers” as the items that appear in the first column of our
data file. In our data file we only have one experiment, so type
“1” in the Data columns to use box (if your data has multiple set
of values, type the numbers of the columns you want to display). We can also play with color scheme options and display
type. We will leave the other options as their defaults. Click
“Submit.”
3. The output window shown in Fig. 18 shows a diagram with all
metabolic pathways of Arabidopsis. The OMICs viewer uses
red to represent highly expressed genes. Multiple genes
involved in gibberellin biosynthesis appear to be highly upregulated and overrepresented in our expression data which suggests that GA biosynthesis may be upregulated in the LEC1
overexpression line.
4. To see in detail the pathways represented in our expression
data, go back to the “Upload Data from File” part of the
Fig. 18 Partial output of AraCyc’s OMICs viewer summarizing the increases in transcript abundance in LEC1
overexpression plants
62
G. Alex Mason et al.