

3.7.3 Classification
SuperViewer
The BAR’s Classification SuperViewer [54] provides a different way
to view Gene Ontology and MapMan classifications for lists of
genes: it uses a barcode scheme. Classification SuperViewer barcodes are also integrated into several others of the BAR’s output
tools.
1. Go to http://bar.utoronto.ca/ntools/cgi-bin/ntools_classifi
cation_superviewer.cgi and input your list of genes (see
Note 19).
2. Select the classification scheme you wish to use under the
second point, either GO (actually GO Slim in the case of this
tool) or MapMan.
3. Leave the other options as they are, and click Submit Query.
4. The output page is divided into three parts: an overview table
showing which categories are enriched (by a hypergeometric
test with a p-value cutoff of 0.05) in bold; a chart area summarizing the category information in a different way, and a detailed
table section, which is linked from the overview area (see
Fig. 16). In these areas the gray background sections are GO
Biological Process terms, those with a white background are
GO Molecular Function terms, while those with a yellow
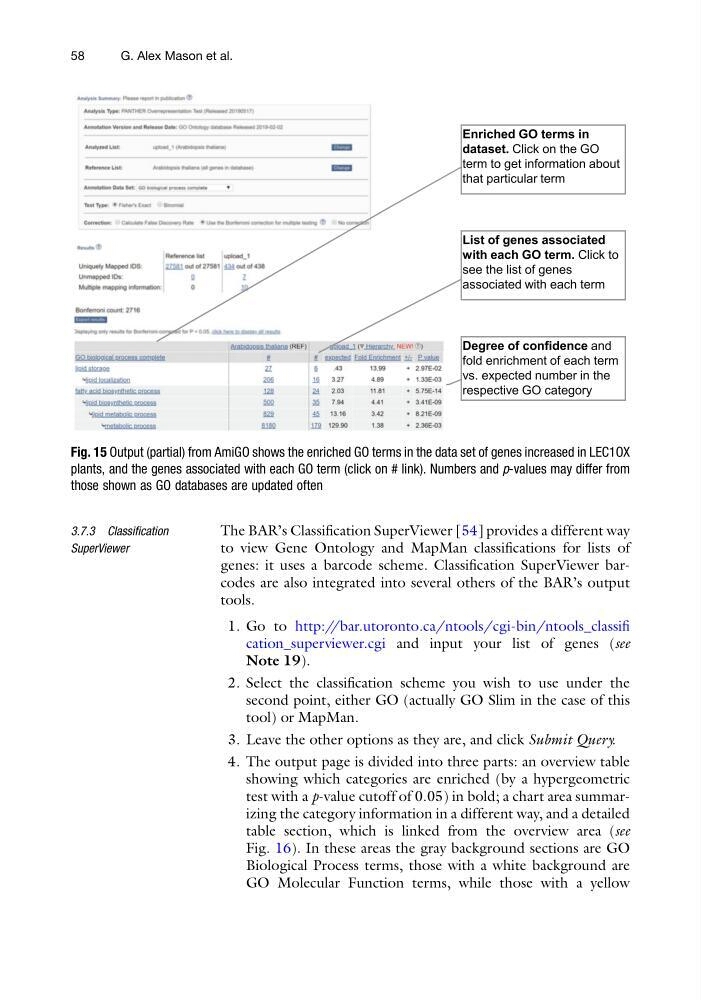
Fig. 15 Output (partial) from AmiGO shows the enriched GO terms in the data set of genes increased in LEC1OX
plants, and the genes associated with each GO term (click on # link). Numbers and p-values may differ from
those shown as GO databases are updated often
58
G. Alex Mason et al.
SuperViewer
The BAR’s Classification SuperViewer [54] provides a different way
to view Gene Ontology and MapMan classifications for lists of
genes: it uses a barcode scheme. Classification SuperViewer barcodes are also integrated into several others of the BAR’s output
tools.
1. Go to http://bar.utoronto.ca/ntools/cgi-bin/ntools_classifi
cation_superviewer.cgi and input your list of genes (see
Note 19).
2. Select the classification scheme you wish to use under the
second point, either GO (actually GO Slim in the case of this
tool) or MapMan.
3. Leave the other options as they are, and click Submit Query.
4. The output page is divided into three parts: an overview table
showing which categories are enriched (by a hypergeometric
test with a p-value cutoff of 0.05) in bold; a chart area summarizing the category information in a different way, and a detailed
table section, which is linked from the overview area (see
Fig. 16). In these areas the gray background sections are GO
Biological Process terms, those with a white background are
GO Molecular Function terms, while those with a yellow
Fig. 15 Output (partial) from AmiGO shows the enriched GO terms in the data set of genes increased in LEC1OX
plants, and the genes associated with each GO term (click on # link). Numbers and p-values may differ from
those shown as GO databases are updated often
58
G. Alex Mason et al.