

2. In normal use, select a data set and enter the AGI ID of
interest. If we had used the AtGenExpress Tissue Set, which
corresponds to the data set shown in Fig. 5, we would identify
many other seed maturation genes and ABA-responsive genes
being coexpressed with ABI3—the top 50 of these are listed in
Supplemental Table S1. Another way to use Expression Angler,
however, is to define a subset of samples in which to search. Use
the “Subselect and Custom Bait Page” link, and then choose a
data set. In this case we will use the “Root Compendium.” On
the input page, we will enter At3g24650 and then select
“Return just the top 50 hits” in the 129 samples of the “Spatiotemporal expression” experiment [31] (see Note 13).
3. Click “Submit Query” at the bottom of the page.
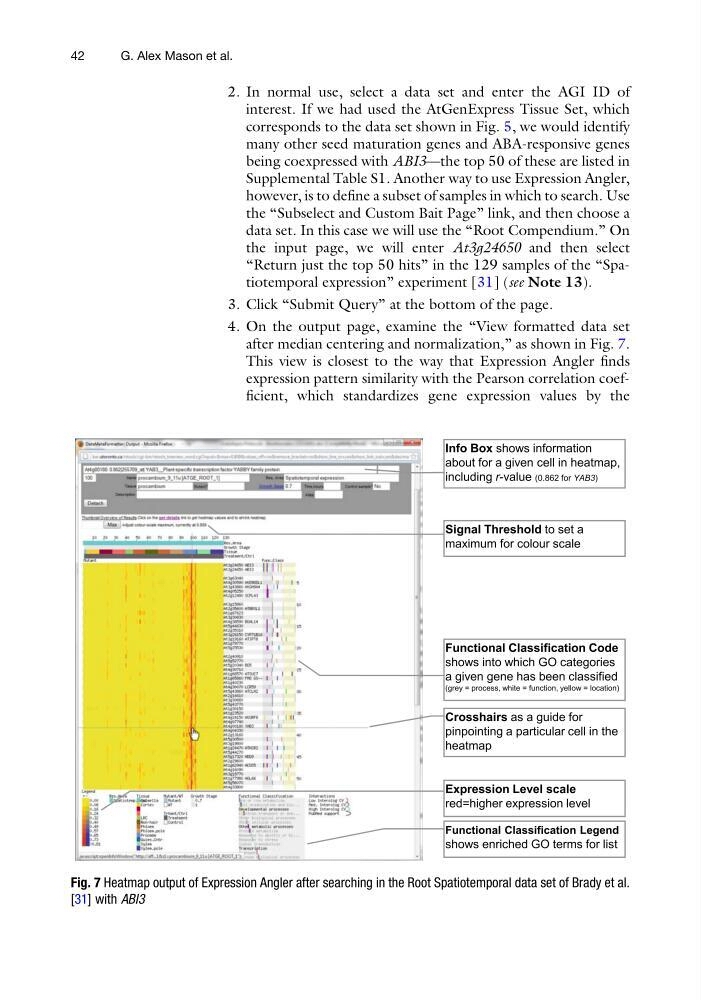
4. On the output page, examine the “View formatted data set
after median centering and normalization,” as shown in Fig. 7.
This view is closest to the way that Expression Angler finds
expression pattern similarity with the Pearson correlation coefficient, which standardizes gene expression values by the
Fig. 7 Heatmap output of Expression Angler after searching in the Root Spatiotemporal data set of Brady et al.
[31] with ABI3
42
G. Alex Mason et al.
interest. If we had used the AtGenExpress Tissue Set, which
corresponds to the data set shown in Fig. 5, we would identify
many other seed maturation genes and ABA-responsive genes
being coexpressed with ABI3—the top 50 of these are listed in
Supplemental Table S1. Another way to use Expression Angler,
however, is to define a subset of samples in which to search. Use
the “Subselect and Custom Bait Page” link, and then choose a
data set. In this case we will use the “Root Compendium.” On
the input page, we will enter At3g24650 and then select
“Return just the top 50 hits” in the 129 samples of the “Spatiotemporal expression” experiment [31] (see Note 13).
3. Click “Submit Query” at the bottom of the page.
4. On the output page, examine the “View formatted data set
after median centering and normalization,” as shown in Fig. 7.
This view is closest to the way that Expression Angler finds
expression pattern similarity with the Pearson correlation coefficient, which standardizes gene expression values by the
Fig. 7 Heatmap output of Expression Angler after searching in the Root Spatiotemporal data set of Brady et al.
[31] with ABI3
42
G. Alex Mason et al.