

4. Clicking on the RPKM column allows you to also sort your
samples based on expression. Finally, data sets can be sorted or
filtered by specifying cutoff values or key words on the headers
of the columns. To identify readmap profiles that best match a
given gene model, we can sort on the r pb column from best
score to worst.
3.4.3 TraVA
Although limited in content, the TraVA webpage presents an intuitive and straightforward interface to study the expression of our
gene of interest. It contains a comprehensive spatiotemporal data
set for Arabidopsis thaliana, encompassing RNA-seq data across
79 organs and developmental stages [28].
1. Go to http://travadb.org/browse. Make sure Arabidopsis is
selected in the dropdown menu at the top of the screen.
2. Type in the AGI ID of your gene of interest next into the input
box, at the top left of the page, e.g., At3g24650 for ABI3.
3. By default, the values shown in the boxes represent read counts
normalized by method applied in median-of-ratio method as
described in Anders and Huber (DESeq/DESeq2) and divided
by maximum value of expression level, so all values vary from
0 to 1. As expected, in the case of ABI3, the largest relative
values correspond to different stages of seed development. We
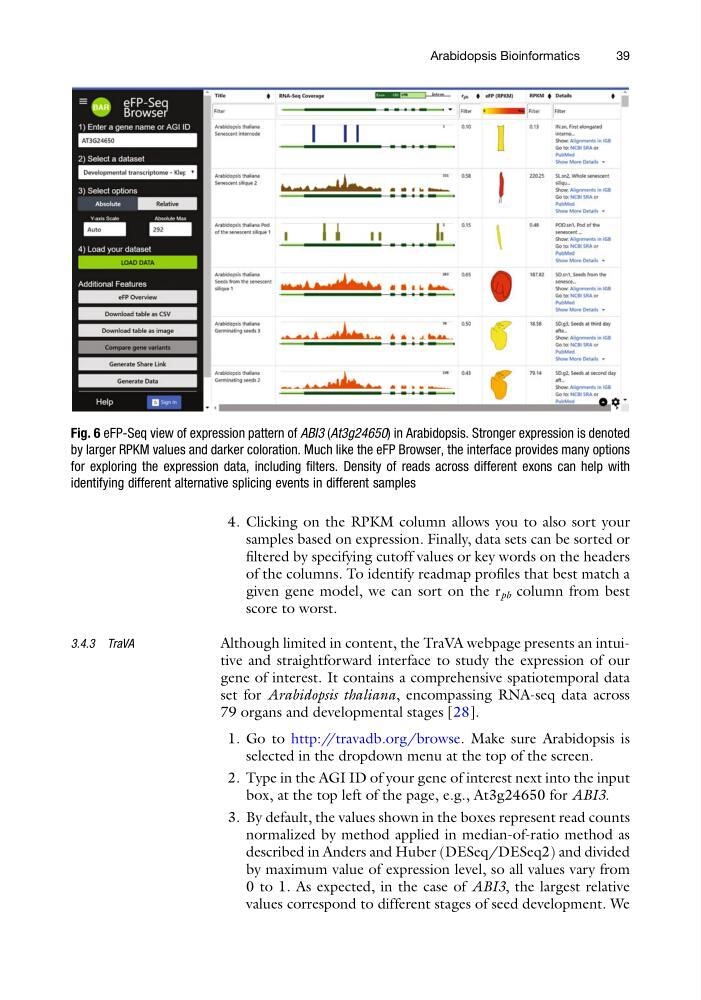
Fig. 6 eFP-Seq view of expression pattern of ABI3 (At3g24650) in Arabidopsis. Stronger expression is denoted
by larger RPKM values and darker coloration. Much like the eFP Browser, the interface provides many options
for exploring the expression data, including filters. Density of reads across different exons can help with
identifying different alternative splicing events in different samples
Arabidopsis Bioinformatics
39
samples based on expression. Finally, data sets can be sorted or
filtered by specifying cutoff values or key words on the headers
of the columns. To identify readmap profiles that best match a
given gene model, we can sort on the r pb column from best
score to worst.
3.4.3 TraVA
Although limited in content, the TraVA webpage presents an intuitive and straightforward interface to study the expression of our
gene of interest. It contains a comprehensive spatiotemporal data
set for Arabidopsis thaliana, encompassing RNA-seq data across
79 organs and developmental stages [28].
1. Go to http://travadb.org/browse. Make sure Arabidopsis is
selected in the dropdown menu at the top of the screen.
2. Type in the AGI ID of your gene of interest next into the input
box, at the top left of the page, e.g., At3g24650 for ABI3.
3. By default, the values shown in the boxes represent read counts
normalized by method applied in median-of-ratio method as
described in Anders and Huber (DESeq/DESeq2) and divided
by maximum value of expression level, so all values vary from
0 to 1. As expected, in the case of ABI3, the largest relative
values correspond to different stages of seed development. We
Fig. 6 eFP-Seq view of expression pattern of ABI3 (At3g24650) in Arabidopsis. Stronger expression is denoted
by larger RPKM values and darker coloration. Much like the eFP Browser, the interface provides many options
for exploring the expression data, including filters. Density of reads across different exons can help with
identifying different alternative splicing events in different samples
Arabidopsis Bioinformatics
39