

2. Enter your gene of interest’s AGI ID (see Note 5) or name. In
our case, we enter “At3g24650” or type “ABI3” for the ABI3
gene into the Primary Gene ID box. Click Go.
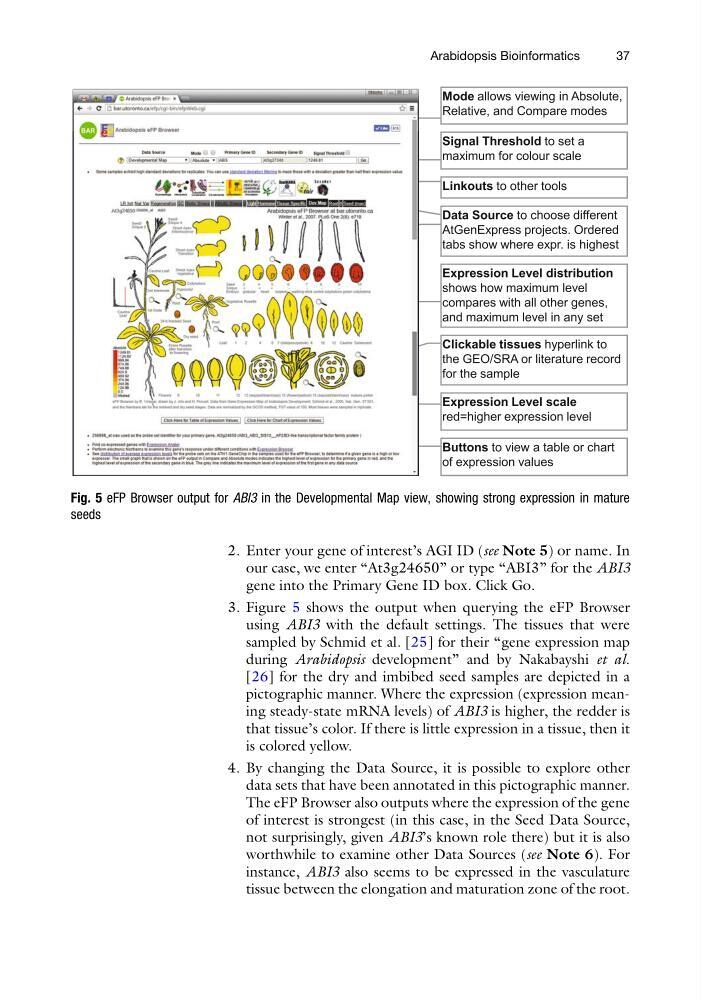
3. Figure 5 shows the output when querying the eFP Browser
using ABI3 with the default settings. The tissues that were
sampled by Schmid et al. [25] for their “gene expression map
during Arabidopsis development” and by Nakabayshi et al.
[26] for the dry and imbibed seed samples are depicted in a
pictographic manner. Where the expression (expression meaning steady-state mRNA levels) of ABI3 is higher, the redder is
that tissue’s color. If there is little expression in a tissue, then it
is colored yellow.
4. By changing the Data Source, it is possible to explore other
data sets that have been annotated in this pictographic manner.
The eFP Browser also outputs where the expression of the gene
of interest is strongest (in this case, in the Seed Data Source,
not surprisingly, given ABI3’s known role there) but it is also
worthwhile to examine other Data Sources (see Note 6). For
instance, ABI3 also seems to be expressed in the vasculature
tissue between the elongation and maturation zone of the root.
Fig. 5 eFP Browser output for ABI3 in the Developmental Map view, showing strong expression in mature
seeds
Arabidopsis Bioinformatics
37
our case, we enter “At3g24650” or type “ABI3” for the ABI3
gene into the Primary Gene ID box. Click Go.
3. Figure 5 shows the output when querying the eFP Browser
using ABI3 with the default settings. The tissues that were
sampled by Schmid et al. [25] for their “gene expression map
during Arabidopsis development” and by Nakabayshi et al.
[26] for the dry and imbibed seed samples are depicted in a
pictographic manner. Where the expression (expression meaning steady-state mRNA levels) of ABI3 is higher, the redder is
that tissue’s color. If there is little expression in a tissue, then it
is colored yellow.
4. By changing the Data Source, it is possible to explore other
data sets that have been annotated in this pictographic manner.
The eFP Browser also outputs where the expression of the gene
of interest is strongest (in this case, in the Seed Data Source,
not surprisingly, given ABI3’s known role there) but it is also
worthwhile to examine other Data Sources (see Note 6). For
instance, ABI3 also seems to be expressed in the vasculature
tissue between the elongation and maturation zone of the root.
Fig. 5 eFP Browser output for ABI3 in the Developmental Map view, showing strong expression in mature
seeds
Arabidopsis Bioinformatics
37