

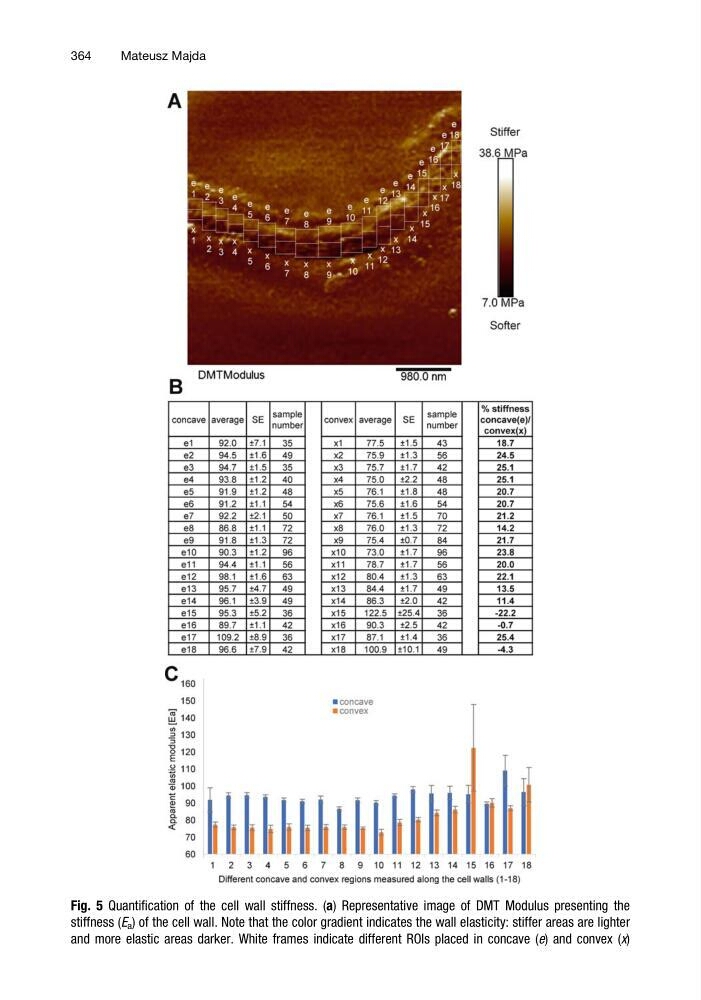
Fig. 5 Quantification of the cell wall stiffness. (a) Representative image of DMT Modulus presenting the
stiffness (E a ) of the cell wall. Note that the color gradient indicates the wall elasticity: stiffer areas are lighter
and more elastic areas darker. White frames indicate different ROIs placed in concave (e) and convex (x)
364
Mateusz Majda
stiffness (E a ) of the cell wall. Note that the color gradient indicates the wall elasticity: stiffer areas are lighter
and more elastic areas darker. White frames indicate different ROIs placed in concave (e) and convex (x)
364
Mateusz Majda