

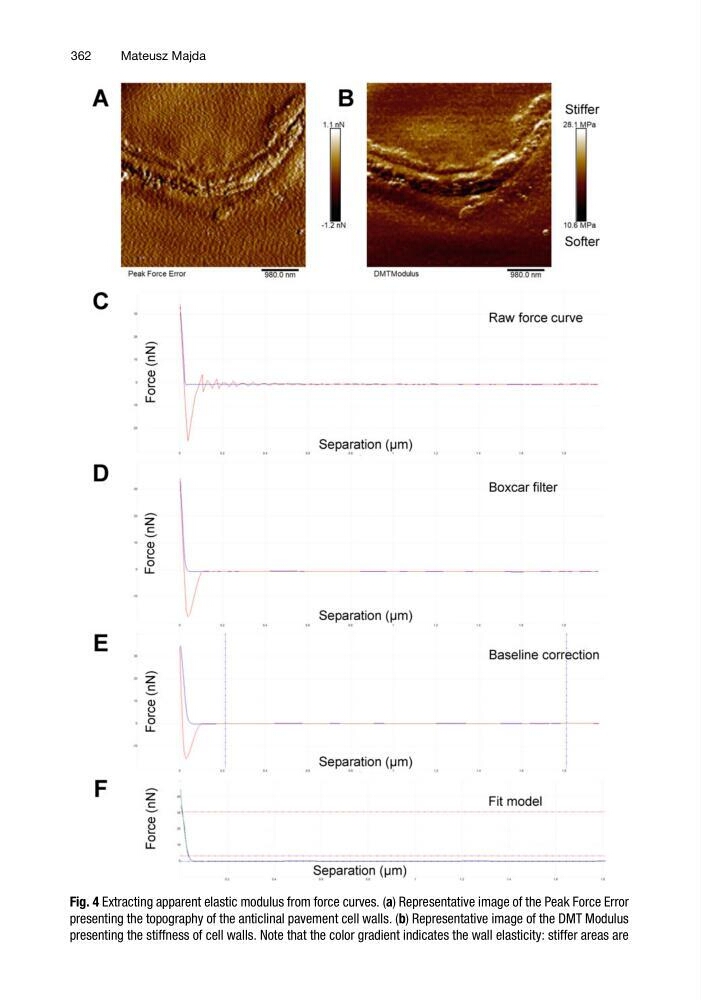
Fig. 4 Extracting apparent elastic modulus from force curves. (a) Representative image of the Peak Force Error
presenting the topography of the anticlinal pavement cell walls. (b) Representative image of the DMT Modulus
presenting the stiffness of cell walls. Note that the color gradient indicates the wall elasticity: stiffer areas are
362
Mateusz Majda
presenting the topography of the anticlinal pavement cell walls. (b) Representative image of the DMT Modulus
presenting the stiffness of cell walls. Note that the color gradient indicates the wall elasticity: stiffer areas are
362
Mateusz Majda