

8. To run the samples, the tube/well is assigned, and then acquire
is enabled. At this point, the FSC, SSC, and single fluorescence
PMT gain settings should be adjusted such that the events are
on scale.
9. After acquisition, unmixing is done, and verified as correct by
checking the Spectral Reference Adjuster. The data is then
exported as FCS files for further analysis using Kaluza or
other software.
10. Finally, the cleaning protocol is run (2 mL 10% bleach followed
by 2 mL deionized water, each lasting about 3 min).
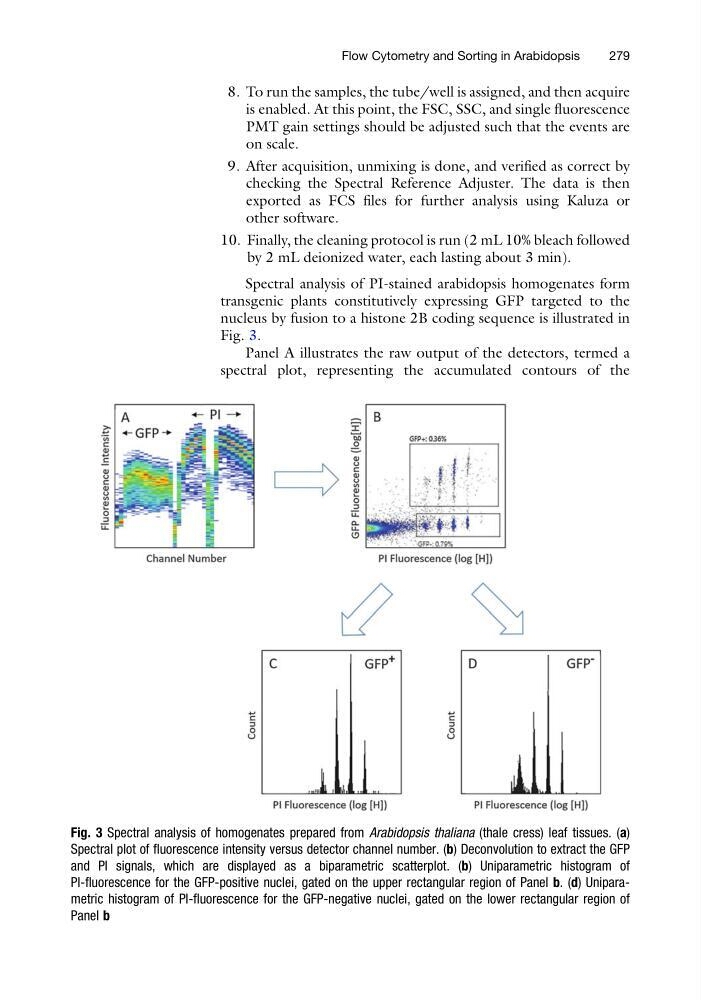
Spectral analysis of PI-stained arabidopsis homogenates form
transgenic plants constitutively expressing GFP targeted to the
nucleus by fusion to a histone 2B coding sequence is illustrated in
Fig. 3.
Panel A illustrates the raw output of the detectors, termed a
spectral plot, representing the accumulated contours of the
Fig. 3 Spectral analysis of homogenates prepared from Arabidopsis thaliana (thale cress) leaf tissues. (a)
Spectral plot of fluorescence intensity versus detector channel number. (b) Deconvolution to extract the GFP
and PI signals, which are displayed as a biparametric scatterplot. (b) Uniparametric histogram of
PI-fluorescence for the GFP-positive nuclei, gated on the upper rectangular region of Panel b. (d) Uniparametric histogram of PI-fluorescence for the GFP-negative nuclei, gated on the lower rectangular region of
Panel b
Flow Cytometry and Sorting in Arabidopsis
279
is enabled. At this point, the FSC, SSC, and single fluorescence
PMT gain settings should be adjusted such that the events are
on scale.
9. After acquisition, unmixing is done, and verified as correct by
checking the Spectral Reference Adjuster. The data is then
exported as FCS files for further analysis using Kaluza or
other software.
10. Finally, the cleaning protocol is run (2 mL 10% bleach followed
by 2 mL deionized water, each lasting about 3 min).
Spectral analysis of PI-stained arabidopsis homogenates form
transgenic plants constitutively expressing GFP targeted to the
nucleus by fusion to a histone 2B coding sequence is illustrated in
Fig. 3.
Panel A illustrates the raw output of the detectors, termed a
spectral plot, representing the accumulated contours of the
Fig. 3 Spectral analysis of homogenates prepared from Arabidopsis thaliana (thale cress) leaf tissues. (a)
Spectral plot of fluorescence intensity versus detector channel number. (b) Deconvolution to extract the GFP
and PI signals, which are displayed as a biparametric scatterplot. (b) Uniparametric histogram of
PI-fluorescence for the GFP-positive nuclei, gated on the upper rectangular region of Panel b. (d) Uniparametric histogram of PI-fluorescence for the GFP-negative nuclei, gated on the lower rectangular region of
Panel b
Flow Cytometry and Sorting in Arabidopsis
279