

3.10.2 Interpreting and
Downloading Results
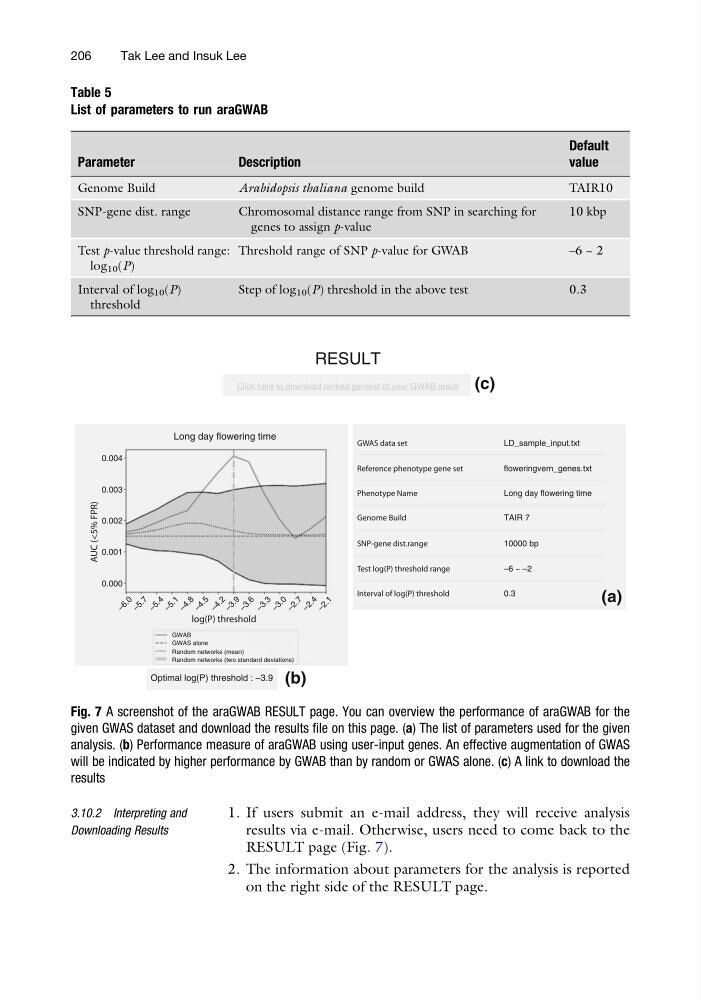
1. If users submit an e-mail address, they will receive analysis
results via e-mail. Otherwise, users need to come back to the
RESULT page (Fig. 7).
2. The information about parameters for the analysis is reported
on the right side of the RESULT page.
Table 5
List of parameters to run araGWAB
Parameter
Description
Default
value
Genome Build
Arabidopsis thaliana genome build
TAIR10
SNP-gene dist. range
Chromosomal distance range from SNP in searching for
genes to assign p-value
10 kbp
Test p-value threshold range:
log 10 (P)
Threshold range of SNP p-value for GWAB
–6 ~ 2
Interval of log 10 (P)
threshold
Step of log 10 (P) threshold in the above test
0.3
RESULT
(c)
(b)
(a)
Long day flowering time
log(P) threshold
AUC (<5% FPR)
GWAS data set
LD_sample_input.txt
Reference phenotype gene set
floweringvern_genes.txt
Phenotype Name
Long day flowering time
Genome Build
TAIR 7
SNP-gene dist.range
10000 bp
Test log(P) threshold range
–6 ~ –2
Interval of log(P) threshold
0.3
GWAB
GWAS alone
Random networks (mean)
Random networks (two standard deviations)
Optimal log(P) threshold : –3.9
0.004
0.003
0.002
0.001
0.000
– 6 . 0
– 5 . 7
– 5 . 4
– 5 . 1
– 4 . 8
– 4 . 5
– 4 . 2
– 3 . 9
– 3 . 6
– 3 . 3
– 3 . 0
– 2 . 7
– 2 . 4
– 2 . 1
Click here to download ranked genelist of your GWAB result
Fig. 7 A screenshot of the araGWAB RESULT page. You can overview the performance of araGWAB for the
given GWAS dataset and download the results file on this page. (a) The list of parameters used for the given
analysis. (b) Performance measure of araGWAB using user-input genes. An effective augmentation of GWAS
will be indicated by higher performance by GWAB than by random or GWAS alone. (c) A link to download the
results
206
Tak Lee and Insuk Lee
Downloading Results
1. If users submit an e-mail address, they will receive analysis
results via e-mail. Otherwise, users need to come back to the
RESULT page (Fig. 7).
2. The information about parameters for the analysis is reported
on the right side of the RESULT page.
Table 5
List of parameters to run araGWAB
Parameter
Description
Default
value
Genome Build
Arabidopsis thaliana genome build
TAIR10
SNP-gene dist. range
Chromosomal distance range from SNP in searching for
genes to assign p-value
10 kbp
Test p-value threshold range:
log 10 (P)
Threshold range of SNP p-value for GWAB
–6 ~ 2
Interval of log 10 (P)
threshold
Step of log 10 (P) threshold in the above test
0.3
RESULT
(c)
(b)
(a)
Long day flowering time
log(P) threshold
AUC (<5% FPR)
GWAS data set
LD_sample_input.txt
Reference phenotype gene set
floweringvern_genes.txt
Phenotype Name
Long day flowering time
Genome Build
TAIR 7
SNP-gene dist.range
10000 bp
Test log(P) threshold range
–6 ~ –2
Interval of log(P) threshold
0.3
GWAB
GWAS alone
Random networks (mean)
Random networks (two standard deviations)
Optimal log(P) threshold : –3.9
0.004
0.003
0.002
0.001
0.000
– 6 . 0
– 5 . 7
– 5 . 4
– 5 . 1
– 4 . 8
– 4 . 5
– 4 . 2
– 3 . 9
– 3 . 6
– 3 . 3
– 3 . 0
– 2 . 7
– 2 . 4
– 2 . 1
Click here to download ranked genelist of your GWAB result
Fig. 7 A screenshot of the araGWAB RESULT page. You can overview the performance of araGWAB for the
given GWAS dataset and download the results file on this page. (a) The list of parameters used for the given
analysis. (b) Performance measure of araGWAB using user-input genes. An effective augmentation of GWAS
will be indicated by higher performance by GWAB than by random or GWAS alone. (c) A link to download the
results
206
Tak Lee and Insuk Lee