

3.5.4 Run EMMAX
It is important to confirm that both .tfam and .tped files have the
same prefix in order to let EMMAX know they are input files for the
analysis.
$emmax -v -d 10 -t 1001genomes_snps_maf0.1 -p glucose_germrate.txt -k
1001genomes_snps_maf0.1.hIBS.kinf -o Ath_glucose_germrate_emmax
-t: tped file prefix
-p: input phenotype file
-k: input kinship matrix file
-o: output file prefix
The above operation results in three output files: Ath_glucose_germrate_emmax.log, Ath_glucose_germrate_emmax.ps, and
Ath_glucose_germrate_emmax.reml.
Calculation of p-values of associations is completed at this step.
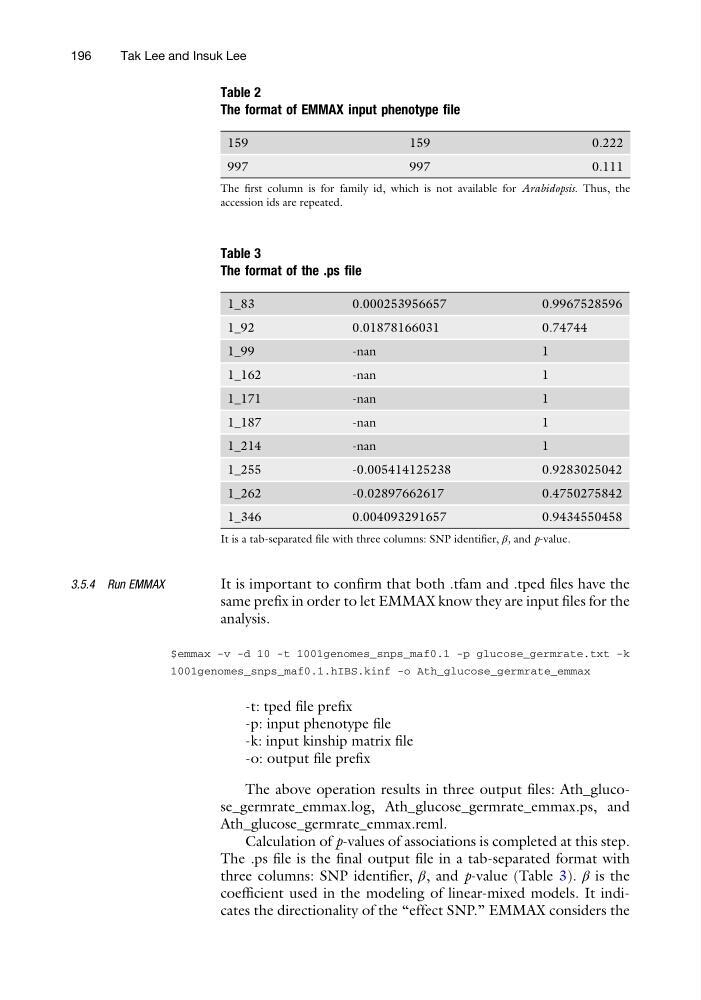
The .ps file is the final output file in a tab-separated format with
three columns: SNP identifier, β, and p-value (Table 3). β is the
coefficient used in the modeling of linear-mixed models. It indicates the directionality of the “effect SNP.” EMMAX considers the
Table 2
The format of EMMAX input phenotype file
159
159
0.222
997
997
0.111
The first column is for family id, which is not available for Arabidopsis. Thus, the
accession ids are repeated.
Table 3
The format of the .ps file
1_83
0.000253956657
0.9967528596
1_92
0.01878166031
0.74744
1_99
-nan
1
1_162
-nan
1
1_171
-nan
1
1_187
-nan
1
1_214
-nan
1
1_255
-0.005414125238
0.9283025042
1_262
-0.02897662617
0.4750275842
1_346
0.004093291657
0.9434550458
It is a tab-separated file with three columns: SNP identifier, β, and p-value.
196
Tak Lee and Insuk Lee
It is important to confirm that both .tfam and .tped files have the
same prefix in order to let EMMAX know they are input files for the
analysis.
$emmax -v -d 10 -t 1001genomes_snps_maf0.1 -p glucose_germrate.txt -k
1001genomes_snps_maf0.1.hIBS.kinf -o Ath_glucose_germrate_emmax
-t: tped file prefix
-p: input phenotype file
-k: input kinship matrix file
-o: output file prefix
The above operation results in three output files: Ath_glucose_germrate_emmax.log, Ath_glucose_germrate_emmax.ps, and
Ath_glucose_germrate_emmax.reml.
Calculation of p-values of associations is completed at this step.
The .ps file is the final output file in a tab-separated format with
three columns: SNP identifier, β, and p-value (Table 3). β is the
coefficient used in the modeling of linear-mixed models. It indicates the directionality of the “effect SNP.” EMMAX considers the
Table 2
The format of EMMAX input phenotype file
159
159
0.222
997
997
0.111
The first column is for family id, which is not available for Arabidopsis. Thus, the
accession ids are repeated.
Table 3
The format of the .ps file
1_83
0.000253956657
0.9967528596
1_92
0.01878166031
0.74744
1_99
-nan
1
1_162
-nan
1
1_171
-nan
1
1_187
-nan
1
1_214
-nan
1
1_255
-0.005414125238
0.9283025042
1_262
-0.02897662617
0.4750275842
1_346
0.004093291657
0.9434550458
It is a tab-separated file with three columns: SNP identifier, β, and p-value.
196
Tak Lee and Insuk Lee