

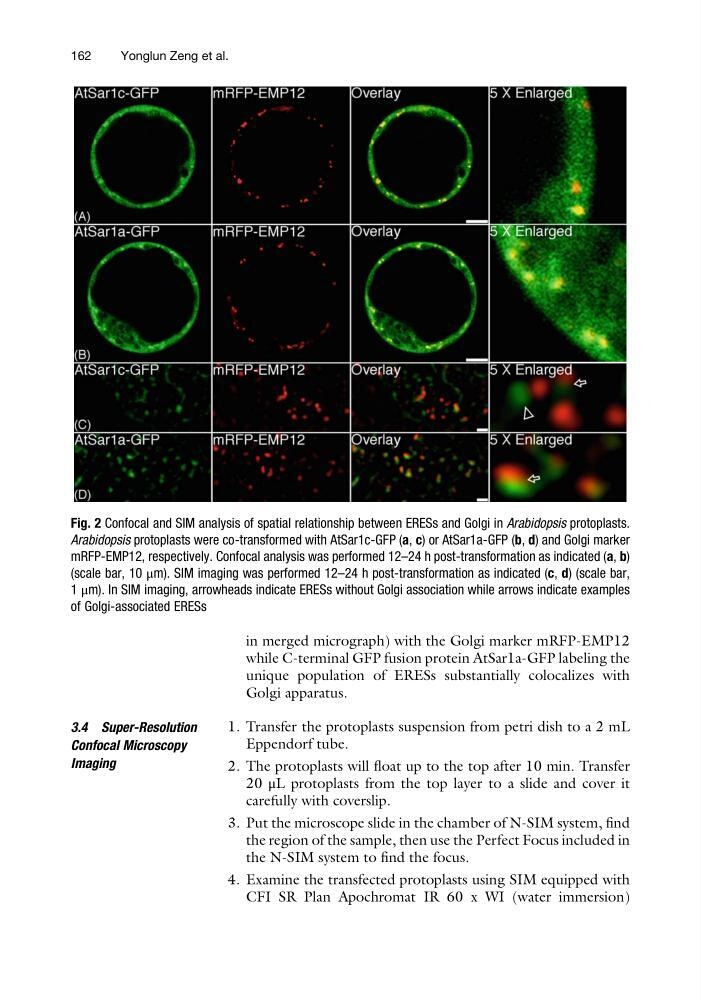
in merged micrograph) with the Golgi marker mRFP-EMP12
while C-terminal GFP fusion protein AtSar1a-GFP labeling the
unique population of ERESs substantially colocalizes with
Golgi apparatus.
3.4 Super-Resolution
Confocal Microscopy
Imaging
1. Transfer the protoplasts suspension from petri dish to a 2 mL
Eppendorf tube.
2. The protoplasts will float up to the top after 10 min. Transfer
20 μL protoplasts from the top layer to a slide and cover it
carefully with coverslip.
3. Put the microscope slide in the chamber of N-SIM system, find
the region of the sample, then use the Perfect Focus included in
the N-SIM system to find the focus.
4. Examine the transfected protoplasts using SIM equipped with
CFI SR Plan Apochromat IR 60 x WI (water immersion)
Fig. 2 Confocal and SIM analysis of spatial relationship between ERESs and Golgi in Arabidopsis protoplasts.
Arabidopsis protoplasts were co-transformed with AtSar1c-GFP (a, c) or AtSar1a-GFP (b, d) and Golgi marker
mRFP-EMP12, respectively. Confocal analysis was performed 12–24 h post-transformation as indicated (a, b)
(scale bar, 10 μm). SIM imaging was performed 12–24 h post-transformation as indicated (c, d) (scale bar,
1 μm). In SIM imaging, arrowheads indicate ERESs without Golgi association while arrows indicate examples
of Golgi-associated ERESs
162
Yonglun Zeng et al.
while C-terminal GFP fusion protein AtSar1a-GFP labeling the
unique population of ERESs substantially colocalizes with
Golgi apparatus.
3.4 Super-Resolution
Confocal Microscopy
Imaging
1. Transfer the protoplasts suspension from petri dish to a 2 mL
Eppendorf tube.
2. The protoplasts will float up to the top after 10 min. Transfer
20 μL protoplasts from the top layer to a slide and cover it
carefully with coverslip.
3. Put the microscope slide in the chamber of N-SIM system, find
the region of the sample, then use the Perfect Focus included in
the N-SIM system to find the focus.
4. Examine the transfected protoplasts using SIM equipped with
CFI SR Plan Apochromat IR 60 x WI (water immersion)
Fig. 2 Confocal and SIM analysis of spatial relationship between ERESs and Golgi in Arabidopsis protoplasts.
Arabidopsis protoplasts were co-transformed with AtSar1c-GFP (a, c) or AtSar1a-GFP (b, d) and Golgi marker
mRFP-EMP12, respectively. Confocal analysis was performed 12–24 h post-transformation as indicated (a, b)
(scale bar, 10 μm). SIM imaging was performed 12–24 h post-transformation as indicated (c, d) (scale bar,
1 μm). In SIM imaging, arrowheads indicate ERESs without Golgi association while arrows indicate examples
of Golgi-associated ERESs
162
Yonglun Zeng et al.